

Crypto Content Creator on Bitget Insights, Binance Square , CmC & Gate Moments .
Joined October 2023
- Tweets11.2K
- Following144
- Followers5.5K
- Likes7.8K




Pinned Tweet
Our Telegram channel delivers daily crypto signals, market trends, and insider tips to keep you ahead of the curve.
👉 Join Now: t.me/+59eDt3_3b5E1MzU1


Join our community to get #BTC updates, swing trades, scalping trades, and #crypto info.
#Growth
xitter.cf/i/communities/18105463…
Not Just Google , How many trees cut down per year ?
@grok , what’s your answer?

$IRYS is Yesterday Top Gainer & Today’s Loser !
Have you traded this coin ? Are you in the Gainers or Losers side ?

DOW LOST 652 POINTS ON FRIDAY WHILE BRENT SETTLED AT $116.72, ITS HIGHEST SINCE APRIL 🚨
Dow fell 1.23% to 52,215 and the S&P 500 lost 0.5% for a second straight losing week (Reuters, AP). This time it wasn't tech: the Nasdaq slipped only 0.2%. Oil did the damage, rising on US–Iran tension, and nearly three of every four S&P stocks fell.
Why it matters:
1. The Fed meets Oct 27–28. Futures give a hike next week only about a 7–15% chance, but December sits near 87%
2. Expensive oil keeps inflation alive, and that keeps hikes on the table.
3. $BTC trades ~80,243, down 1.6% in 24h, under its daily MA20 (~82,550) and MA50 (~81,800), with a fresh 24h low at 79,179.
Thursday it was AI fears, Friday it was oil. Bitcoin keeps getting hit from a different side every day, and I'm not buying the dip until the Fed tells us what $100+ oil means for December. 200-day average sits way down at 72,908, so the big trend is still up.
🤖 Made with AI

ETF Flows Update (23 October 2026)
• $BTC : -$137.94 Million
• $ETH : +$4.35 Million
• $XRP : $0
• $SOL : $0
• $HYPE : $0
• $ZEC : +$20.52 Million
Bitcoin ETF recorded outflows of $137.94M on October 23, its second straight day of withdrawals. Ethereum posted a modest inflow of $4.35M and Zcash attracted solid inflows of $20.52M, while XRP, Solana and Hyperliquid remained flat.

When $AVA reached the $0.41–$0.40 support zone and tried to recover?
Buyers pushed the price back toward $0.45, but it got rejected around $0.448. Sellers took control again, and now the $0.40–$0.41 support has been lost.
Price has now reached the $0.36–$0.37 major trend support zone.
Why is this zone important? 👀
If bulls show strength here and defend the support, we could see a reversal toward $0.44–$0.45 again.
But if buyers fail to defend $0.36–$0.37, the downside risk increases significantly, with $0.30–$0.20 becoming a deeper downside zone to watch.
Key levels:
Major support: 0.36–0.37
Recovery zone: 0.40–0.41
Resistance: 0.44–0.45
Guys, this is a critical point for AVA. A strong reaction here could give bulls another chance, but a breakdown could open the door to further losses.

Guys, $AVA got rejected hard from the resistance zone and dropped straight back to support. Look at those red candles! 🔻
Price is now hovering around $0.42, with the recent low near $0.408.
Now the next move depends on this support zone.
If price loses $0.408–$0.40, we could see another leg down toward $0.37–$0.36.
But if buyers recover and push price back above $0.45, this drop could turn into a correction, opening the possibility of another resistance test around $0.47–$0.49.
Big moves ahead, guys!
Don’t rush into a position right now. Wait for confirmation, then pick your side. This volatility can create opportunities, but entering blindly can hurt.

solana:G7vQWurMkMMm2dU3iZpXYFTHT9Biio4F4gZCrwFpKNwG — SUPPORT LOST! LOWER LOWS INCOMING?
Guys, $0.13–$0.14 support zone we were watching has now broken
Bearish pressure is getting stronger, and the short-term structure is now making lower highs and lower lows.
If sellers maintain control and price continues breaking support, $0.10–$0.09 could be next.


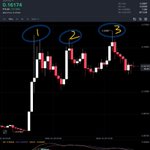
Guys, $BIRB has now faced rejection from the $0.20–$0.21 resistance zone for the third time. After pumping to a high of $0.20887, sellers are still defending this zone, and bearish pressure remains intact on the 15m chart.
Price is now around $0.162, with momentum weakening and MACD showing bearish pressure.
I’m watching the $0.14–$0.13 support zone next. If price retests this area and buyers defend it, we could see another bounce toward $0.20.
But if price loses $0.13 with strong selling pressure, the correction could become much deeper like 0.1 -0.09 .
On the other hand, if buyers push back above $0.20–$0.21 and sustain the breakout, we could see a strong expansion toward $0.25–$0.30.
Key levels to watch:
Support: $0.14–$0.13
Resistance: $0.20–$0.21
Targets - 0.20, 0.22, 0.25, 0.30
For now, the resistance rejection is clear, but the next move depends on how price reacts at support.

I just updated my @Binance app, and look what HAPPENED!!
2,500,000 additional AI Pro credits — added to my Binance account 💛
If you’re using Binance, this might be worth checking out too!
🤖 What can you do with Binance AI Pro?
🔹 AI-powered research — explore topics and get insights faster.
🔹 Content creation — brainstorm ideas, draft posts, and improve your writing.
🔹 Market analysis support — organize information and explore crypto market trends.
🔹 AI assistance — ask questions, summarize information, and help with everyday tasks.
🔹 More room to explore — use your credits to try the available AI Pro features.
⚠️Want to check out this opportunity?
Use my referral link to join Binance and see whether this limited offer is available to you:
binance.com/join?ref=CRYPTOS…


We heard you loud and clear.
So we gave the Standard Plan a boost, completely free:
• Access to more powerful LLM models
• 10X more credits than before, now with 2,500,000 credits
On mobile? Update to iOS 3.22.2+ or Android 3.22.0+ to get the latest version.
Explore AI Pro 👉 ai.binance.com/

Guys, $BIRB has now faced rejection from the $0.20–$0.21 resistance zone for the third time. After pumping to a high of $0.20887, sellers are still defending this zone, and bearish pressure remains intact on the 15m chart.
Price is now around $0.162, with momentum weakening and MACD showing bearish pressure.
I’m watching the $0.14–$0.13 support zone next. If price retests this area and buyers defend it, we could see another bounce toward $0.20.
But if price loses $0.13 with strong selling pressure, the correction could become much deeper like 0.1 -0.09 .
On the other hand, if buyers push back above $0.20–$0.21 and sustain the breakout, we could see a strong expansion toward $0.25–$0.30.
Key levels to watch:
Support: $0.14–$0.13
Resistance: $0.20–$0.21
Targets - 0.20, 0.22, 0.25, 0.30
For now, the resistance rejection is clear, but the next move depends on how price reacts at support.
$BIRB — Can Bulls Push It Toward $0.25?
Price has surged over 200%, climbing from $0.05705 to a high of $0.20325. Now price is consolidating near $0.181 after the explosive move.
On the 15m chart, price is holding above the previous breakout area around $0.14, while MACD remains positive. RSI around 67 shows bullish momentum, although buyers should be careful after such an extended pump.
Resistance: $0.203–$0.205
If price breaks and holds above $0.203, the next levels to watch are $0.22, followed by $0.25.
Support: $0.14–$0.13
If price loses this support zone, the breakout structure could weaken and a deeper pullback may follow.

$IRYS BEARS ARE STILL IN CONTROL 📉
Guys, I told you $0.07 was coming, and our target has been reached!
Price has continued making lower highs and lower lows. Price is now around $0.070, and bearish pressure is getting more intense.
Now I’m watching the next levels closely.
If sellers maintain control and price breaks below $0.070, we may see $0.063–$0.060 soon. If the selling pressure continues, $0.055 is also in sight.
Scalping opportunities are there, but don’t blindly chase every red candle. Sharp relief bounces can happen after such a heavy drop.
Key levels to watch: 0.070, 0.063, 0.060, 0.055


magma-finance:native has dropped nearly 41% in the past 24 hours, and showing strong selling pressure. Sellers are clearly dominating right now.
Price is trading around $0.300, with the latest low near $0.296. MACD is turning sharply bearish, while RSI is deeply oversold. We may see a short relief bounce before the next leg down.
I’m watching for a possible retest of the $0.32–$0.34 zone. If price gets rejected there, the downside targets are 0.31, 0.30, 0.28, 0.26
Stop-loss: 0.35
If selling pressure continues without a bounce, price could reach the $0.26 zone sooner. Don’t enter blindly after such a sharp dump.
Let the retest happen, watch the rejection, and wait for confirmation. Big volatility means big risk, guys. ⚠️

$IRYS going DOWN 🔻🔻🔻🔻🔻

A few hours ago, irys:native dropped from 0.5 to 0.06—all in just one hour. This kind of move is expected, as the coin recently surged from 0.016 to 0.5 in just five to six days. A sharp drop in such a short period isn't surprising.
MARKET is tough. FIGHT it, but never go against the TREND.
Currently, the price is holding a short-term support zone between 0.092 and 0.097. If this holds, we could see a recovery toward 0.12, 0.13, 0.14, 0.15, or 0.20.
Losing this support could trigger further downside momentum toward 0.083, 0.075, 0.064, 0.05, or 0.03.

$BIRB — Can Bulls Push It Toward $0.25?
Price has surged over 200%, climbing from $0.05705 to a high of $0.20325. Now price is consolidating near $0.181 after the explosive move.
On the 15m chart, price is holding above the previous breakout area around $0.14, while MACD remains positive. RSI around 67 shows bullish momentum, although buyers should be careful after such an extended pump.
Resistance: $0.203–$0.205
If price breaks and holds above $0.203, the next levels to watch are $0.22, followed by $0.25.
Support: $0.14–$0.13
If price loses this support zone, the breakout structure could weaken and a deeper pullback may follow.
Guys, $AVA got rejected hard from the resistance zone and dropped straight back to support. Look at those red candles! 🔻
Price is now hovering around $0.42, with the recent low near $0.408.
Now the next move depends on this support zone.
If price loses $0.408–$0.40, we could see another leg down toward $0.37–$0.36.
But if buyers recover and push price back above $0.45, this drop could turn into a correction, opening the possibility of another resistance test around $0.47–$0.49.
Big moves ahead, guys!
Don’t rush into a position right now. Wait for confirmation, then pick your side. This volatility can create opportunities, but entering blindly can hurt.
$AVA — ARE WE ENTERING THE NEXT STAGE OF EXPANSION !!
Price just entered the major resistance zone at $0.47–$0.51, guys!
After a massive recovery from the $0.0856 low, AVA is now up nearly 28% today. The momentum is strong, but this is where sellers could step in and push buyers down.
Here’s the key level I’m watching:
If buyers reclaim $0.51 and hold above it strongly, we could see the next expansion toward:
Targets - 0.55, 0.60, 0.66, 0.72, 0.80
But if AVA gets rejected from this resistance zone, a pullback wouldn’t be surprising. If price loses $0.44, we could see a short-term move toward $0.40.
The 3-day chart is showing strong momentum, but RSI is already extremely overbought, so don’t blindly chase this pump.
Will AVA break through $0.51 or get rejected first?
CALDERA IS GOING CRAZY, GUYS! 🔥
$ERA has been damn volatile over the past 18 days. Almost every day, we’re seeing moves of 5%–27%, and in just the last 2 days, $ERA has surged around 40%!
Currently trading at $0.0916, up 35% today and sitting among the top 5 gainers. At this pace, it wouldn’t surprise me if ERA pushes toward the top 1 or 2 gainers in the upcoming hours.
Now the important thing is support.
key support zone sits at $0.077–$0.080. As long as price holds this zone and buyers maintain momentum, the bullish move could continue.
Looking at the daily chart, the next resistance zones are around $0.0955, then $0.1-0.11-0.12-0.14-0.16 . If momentum stays strong, even higher levels could come into play.
But don’t forget how volatile this coin is. RSI is already heating up, so sharp pullbacks are possible too. Avoid chasing green candles blindly.
What do you think, guys? Can $ERA enter the top 2 gainers next?

A few hours ago, irys:native dropped from 0.5 to 0.06—all in just one hour. This kind of move is expected, as the coin recently surged from 0.016 to 0.5 in just five to six days. A sharp drop in such a short period isn't surprising.
MARKET is tough. FIGHT it, but never go against the TREND.
Currently, the price is holding a short-term support zone between 0.092 and 0.097. If this holds, we could see a recovery toward 0.12, 0.13, 0.14, 0.15, or 0.20.
Losing this support could trigger further downside momentum toward 0.083, 0.075, 0.064, 0.05, or 0.03.
💰 $BTC /USDT
🔼 LONG
✳️ ENTRY (Use DCA STRATEGY): 80800, 80600, 80400
🎯 TARGETS: 81300, 81800, 82400, 83000, 84000
🀄️ LEVERAGE: cross 100x
🔴 STOPLOSS: 80030
📊 Why this long
- A bid wall sits at 80,800. About 399 BTC (~$32M) is resting at 80,800–80,899, and 80,700–80,799 adds about 116 BTC. That lines up with the first entry.
- 24h low is 80,461, and the last DCA at 80,400 sits just under it. A sweep of that low would fill the final entry.
- stoploss at 80,030 is below the 24h low and the 80K area, so it only triggers if that support fails.
- The first target at 81,300 is just past the 81,000 ask cluster (about 114 BTC). The big sell wall is at 80,900–80,999 with about 418 BTC (~$34M), so expect resistance there first. Above that, the 1H high is 82,035, which matches the 81,800 and 82,400 targets.
- 4Hr range top is 84,875, which fits the final 84,000 target.
⚠️ Using 100x leverage means roughly a 1% move against the position liquidates it, so keep size small and respect the stop.

Last week nobody even had irys:native on their watchlist. Today it's the loudest chart on the board 🔥
It went from 0.0117 to 0.1188 in 5 days. That's a 10x bro
$100 on Oct 18 would've been about $1,000 at today's top.
And the shorts got destroyed. $17.9M got liquidated in 24 hours, and $16.46M of it, almost 92%, was shorts. 12,752 traders got wiped out. The single biggest liquidation was $412K, and the worst hour was 9:30 to 10:30 PM IST tonight, when $6.2M of shorts got burned in one hour.
That's 6x the normal 7-day liquidation level. Over $1.2 billion traded in a single day. The people betting against it basically fueled the rocket.
What gets me is that there's no big announcement and no news behind it. It's pure momentum, the crowd showing up all at once.
Honestly, I'm not chasing it up here. When a chart goes this vertical, the next move is usually just as wild in either direction. The smart play is to let it cool down, see where buyers step in, and stay hungry for the next one, not desperate for this one.

ETHEREUM JUST CALLED OFF THE GLAMSTERDAM TESTNET FORK, 3 DAYS BEFORE LAUNCH 👾
Core devs pulled the Hoodi testnet activation set for Oct 26 at 17:42 UTC during Thursday's ACDE #248 call, and the Ethereum Foundation confirmed it on Oct 22. The planned raise of Hoodi's gas limit to 200M is gone too, and no new date is set. The reason is EIP-8037, the change that reprices creating new state. ChainSecurity showed that with EIP-8038 it can leave some existing contracts with more or less gas than they expect, so a failed step may get recorded for good instead of reverting, or a new storage write may cost 110,020 gas instead of 22,100. ChainSecurity hasn't shown that any major protocol is exploitable. Mainnet users don't need to do anything, but Glamsterdam, which brings built-in proposer-builder separation and bigger blocks, now has a later timeline, and mainnet never had a date.
$ETH trades ~2,400, flat on the day after a 2,359 low, and still under its 2,493 daily MA20.
4H chart:
• Testing: 2,380–2,392
• If defended: 2,431, then 2,527
• If lost: 2,359, then 2,313
Daily chart:
• Testing: 2,359–2,402
• If defended: 2,493, then 2,549
• If lost: 2,313, then 2,156
Hold 2,359 → the delay stays a non-event, 2,493 is the magnet
Lose 2,359 → 2,313, then 2,156 come back
🤖 Made with AI
