

Insights, charts and data to create shared knowledge and expand our understanding of India.
- Tweets390
- Following11
- Followers10K
- Likes10
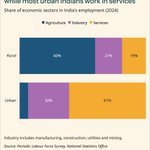




ALT Title: Agriculture employs the most rural Indians, while most urban Indians work in services Sub-title: Share of economic sectors in India’s employment (2024) Explanation: In 2024, agriculture employed 60% of rural workers, industry 21% and services 19%. In urban areas, services employed 61% of workers and industry 32%, with a small share working in agriculture. Industry includes manufacturing, construction, utilities and mining. Source: Periodic Labour Force Survey, National Statistics Office Attribution: Data For India | CC BY


ALT Title: Over 99% of households in rural India use electricity as their main source of lighting Sub-title: Primary source of energy for household lighting, over time Explanation: Between 1983 and 2024, the share of rural Indian households using electricity as their main source of lighting rose from about 15% to over 99%. Over the same period, the share using kerosene fell from about 84% to virtually zero. Electricity overtook kerosene in the early 2000s. Source: Household Consumption Expenditure Survey, National Statistics Office Attribution: Data For India | CC BY


ALT Title: Changes in pre-monsoon rainfall metrics Sub-title: 2025 saw the most intense pre-monsoon rainfall in India Explanation: Annual pre-monsoon rainfall in India from 1951 to 2025, measured in millimetres. Total seasonal precipitation, maximum five-day rainfall, and maximum one-day rainfall all trend upward, with sharper increases after 2015. In 2025, total precipitation reached 126 mm, the second-highest level since 1951; maximum one-day and five-day rainfall both reached their highest levels in the series. This points to heavier rainfall increasingly concentrated in intense spells. Source: India Meteorological Department Attribution: Data For India | CC BY


ALT Title: Motor vehicle claims and marriage disputes lead civil cases in India’s lower courts Sub-title: Top five most commonly invoked civil legislations (2010–2020) Explanation: A horizontal bar chart ranks the five most commonly invoked civil legislations in descending order by number of records. The civil provisions of the Motor Vehicles Act lead with 1.75 million records, followed by the Hindu Marriage Act with 1.34 million. The Registration of Births and Deaths Act accounts for 852,037 records, the Domestic Violence Act for 398,756, and the Arbitration Act for 332,338. Source: e-Courts, Development Data Lab Judicial Portal Attribution: Data For India | CC BY


ALT Title: Over 7 in 10 children across India are fully vaccinated, and fewer than 1 in 10 have not received any vaccinations at all. Sub-title: Share of children aged one who have received all vaccines or no vaccines, across Indian states (2021). Explanation: More than 70% of one-year-olds in India are fully vaccinated, while fewer than 10% have received no vaccines. Odisha has the highest share of fully vaccinated children. Several north-eastern states have the highest shares of one-year-olds with no vaccinations. Full vaccination is defined by NFHS as receiving BCG, three doses of oral polio vaccine, three doses of DPT or pentavalent vaccine, and the first dose of measles vaccine. Source: National Family Health Survey, International Institute for Population Sciences. Attribution: Data For India | CC BY

ALT Title: Over 7 in 10 children across India are fully vaccinated, and fewer than 1 in 10 have not received any vaccinations at all. Sub-title: Share of children aged one who have received all vaccines or no vaccines, across Indian states (2021). Explanation: More than 70% of one-year-olds in India are fully vaccinated, while fewer than 10% have received no vaccines. Odisha has the highest share of fully vaccinated children. Several north-eastern states have the highest shares of one-year-olds with no vaccinations. Full vaccination is defined by NFHS as receiving BCG, three doses of oral polio vaccine, three doses of DPT or pentavalent vaccine, and the first dose of measles vaccine. Source: National Family Health Survey, International Institute for Population Sciences. Attribution: Data For India | CC BY


ALT Title: Share of government jobs in the workforce by state (2024) Sub-title: North-eastern states have the highest shares of workers in government jobs Explanation: Government jobs account for the highest shares of employment in north-eastern states, with around one in four workers in Mizoram, Nagaland and Sikkim in government jobs. Shares are much lower in several large northern and central states: 3% in Uttar Pradesh and Bihar, and 4% in Madhya Pradesh. Tamil Nadu has a higher share, at 12%. Source: Periodic Labour Force Survey, National Statistics Office (2023–24) Attribution: Data For India | CC BY


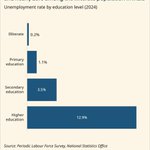
ALT Title: The unemployment rate is highest among graduates and nearly zero among the illiterate population in India Sub-title: Unemployment rate by education level (2024) Explanation: In 2024, unemployment in India increased sharply with education level. The rate was 0.2% among the illiterate population, 1.1% among people with primary education, 3.5% among those with secondary education, and 12.9% among those with higher education. Source: Periodic Labour Force Survey, National Statistics Office Attribution: Data For India | CC BY


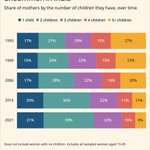
ALT Title: Large families are becoming increasingly uncommon in India Sub-title: Share of mothers by the number of children they have, over time Explanation: The share of mothers with five or more children fell from 27% in 1993 to 8% in 2021, while the share with two children rose from 21% to 39%. Over the same period, the share with one child increased from 17% to 21%, the share with three children rose slightly from 20% to 22%, and the share with four children declined from 15% to 10%. The data excludes women with no children and includes sampled women ages 15–49. Source: National Family Health Survey, International Institute for Population Sciences Attribution: Data For India | CC BY


ALT Title: Household weekly food consumption (2021) Sub-title: The richest Indian households can eat fruit most often Explanation: Fruit consumption rises sharply with household wealth: 69% of the richest households eat fruit weekly, compared with 52% of middle-income households and 36% of the poorest. Weekly fried food consumption is almost identical across wealth groups, at 43–44%. Source: National Family Health Survey, International Institute for Population Sciences Attribution: Data For India | CC BY