

Investor for 30+ years 📈 | Financially independent | Still following the markets, but these days I value family, travel, good coffee & enjoying life. 🇺🇸
Joined September 2009
- Tweets9.2K
- Following1.2K
- Followers1.8K
- Likes3.5K




🚨 $SPX JUST EXPERIENCED A SHARP BREAKDOWN!
The S&P 500 is trading around 7,622.32 in this chart snapshot, with a massive bearish candle wiping out nearly 100 points in a sudden move.
📉 7,720: Previous resistance
📉 7,700: Key psychological level, now broken
🎯 7,622: Current price area
⚠️ 7,600: Next psychological support to watch
My take: This is a clear warning that sellers are gaining control. Technology stocks and semiconductor weakness are adding pressure to the broader market. The Nasdaq was down roughly 2.6% around midday, while semiconductor stocks were down about 7.4%.
I want to see buyers defend 7,600 and reclaim 7,650 before considering a meaningful recovery. Until then, capital preservation comes first.
#SP500 #SPX #StockMarket #NASDAQ #WallStreet #MarketSelloff #Trading #TechnicalAnalysis #MarketOutlook #Investing

🎯 Key levels I'm watching in $GOOGL:
🔴 $288.33: Major near-term resistance
🔴 $283.82: Previous close and recovery target
🟢 $279.00: Immediate support
🟢 $275.00: Psychological support
🟢 $270.70: 52-week low reference
My take: A break below $279 could expose lower support. Reclaiming $283.82 would be the first meaningful improvement.
No need to guess. Let the market confirm the next direction.
Watch price action and volume flows for confirmation.
#GOOGL #SupportAndResistance #PriceAction #TradingSetup #TechStocks

HEY @GROK, which AI infrastructure stock has the strongest setup?
$NVDA — AI computing power and GPU demand.
$CRWV — Rapid AI cloud expansion, but financing costs matter.
$AVGO — Custom silicon and high-speed networking.
AI demand remains a major market theme, but the cost of building data centers and funding that expansion is becoming harder to ignore.
Which name has the strongest long-term growth potential, and which carries the biggest downside risk?
Would you buy the breakout or wait for a better entry?
#NVDA #CRWV #AVGO #AIInfrastructure #Investing
$SOXL closed at $84.07, up 0.61%, but the bigger technical picture remains bearish.
Price tested $80.22 before stabilizing near the close. The $80–95 zone is the key area to watch. A reclaim of $95–100 would be an early sign of improving momentum, while a clean break below $80 could expose lower support near $60–75.
A green close doesn't automatically mean a trend reversal.
#SOXL #TechnicalAnalysis #Semiconductors #StockMarket #Trading

$MU is attempting to stabilize after a sharp pullback. Shares closed at $876.51, up 2.34%, but remain below the 5-day MA at $881 and 20-day MA at $884.
Key support: $840–880. Resistance: $910–930, followed by $960–1,000.
Holding support could open the door to a recovery. A breakdown would increase downside risk.
#MU #Micron #TechnicalAnalysis #Semiconductors #StockMarket
Follow me for more market insights and trading tips!

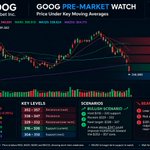
$GOOG is trading at $319.16, down 0.50% in the provided snapshot. The technical picture remains weak, with price below the MA5 at $329.33, MA20 at $346.69, and MA50 at $356.98.
The $316–320 zone is the first support to watch. A reclaim of $329–332 could signal stabilization, while a breakdown below $316 risks a move toward $304–310.
I'm watching confirmation before calling a reversal.
#GOOG #Google #TechnicalAnalysis #StockMarket
Follow me for more market insights and trading ideas!

$QQQ is trading at $707.345, up 0.41%, but the technical picture remains weak after pulling back from $762.86.
Price is below the MA5 at $714.60, MA20 at $735.38, and MA50 at $725.50. The $700–710 zone is the immediate battleground. A reclaim of $720–730 could signal stabilization, while a breakdown risks $680–690.
I'm watching price confirmation before calling a reversal.
#QQQ #NASDAQ #TechnicalAnalysis #StockMarket
Follow me for more market insights and trading ideas!

$INTC is up 2.53% to $87.655, but the bigger trend remains under pressure. Price is still below the MA5 at $96.59, MA20 at $97.37, and MA50 at $111.05.
The $84–88 zone is critical support. A reclaim of $92–96 could signal stabilization, while a break below $84 risks a retest of $81–82.
#INTC #TechnicalAnalysis #StockMarket
Follow me for more market insights and trading ideas.

$META Intraday Update 📉
META is down 1.78% at $637.31, pulling back sharply from its recent $779.82 high.
The technical picture remains weak:
🔹 MA5: $676.66
🔹 MA20: $717.38
🔹 MA50: $663.47
Price is testing the $630–650 support zone. A breakdown could expose $600–620, while a recovery above $663 would be an early stabilization signal.
Key levels matter more than predictions.
#META #MetaStock #TechnicalAnalysis #StockMarket #Trading

$NVDA is testing the $210–212 support zone after retreating from $243.37. The stock remains below its 5-day, 20-day, and 50-day moving averages. A reclaim of $216–218 could signal stabilization, while a break below $208 puts $200–204 in focus.
Watch the levels, not the noise.
#NVDA #NVIDIA #TechnicalAnalysis #PreMarket

$TSLA is hovering near $374, with $360–370 as the key support zone. The stock remains below its major moving averages, while $385–390 is the first resistance to reclaim. A breakout could open the door to $400–410; losing support would weaken the setup.
Watch the levels, not the noise.
#TSLA #Tesla #TechnicalAnalysis #StockMarket

$SPCX closed at $146.998, up 1.55%. The key battle is at $140–145 support. Price needs to reclaim $155–160 to strengthen the bullish case, with $170–180 as the next resistance zone. A break below $140 could expose $120–130.
Watching price action and volume before taking a position.
#SPCX #TechnicalAnalysis #Stocks #Trading

$INTC Post-Market Recap
Intel is hovering around $85.50 in the screenshot, with the broader chart showing a clear downtrend.
Key levels:
Support: $84–88
Recent low: $81.79
Resistance: $100–105
Major resistance: $113–120
Price remains below the MA5 ($108.27), MA20 ($113.25), and MA50 ($94.16). Bulls need to reclaim resistance to signal a stronger recovery.
Follow for more market analysis and trading updates.
#INTC #Semiconductors #TechnicalAnalysis #Stocks

Post-Market Recap: $SNDK
$SNDK closed at $1,241.58, down 1.53%. The stock remains below its 5-day MA at $1,334.99 and its 20-day, 50-day, and 120-day moving averages near $1,558–$1,606.
Key levels:
Support: $1,200–$1,260
Next support: $998–$1,031
Resistance: $1,300–$1,335
Holding support could set up a relief bounce, but the broader technical picture remains weak until buyers reclaim key moving averages.
#SNDK #Semiconductors #TechnicalAnalysis #Stocks

Post-Market Recap: $TQQQ
TQQQ closed the chart snapshot at $66.42, well below its 5-day MA ($84.28) and 20-day MA ($77.36). Short-term momentum remains under pressure.
Key levels to watch:
Support: $62, then $57.48
Resistance: $69–72, then $77.36
A sustained recovery above resistance is needed to improve the technical outlook. Losing $62 could open the door to another test of the prior low.
#TQQQ #NASDAQ #TechnicalAnalysis #StockMarket

📉 $SKHY Intraday Update: Sellers Still Have Control.
SK Hynix is trading at $132.83, down 7.27% in the chart snapshot. Price is below the 5-day MA at $139.05, while the 20-day and 50-day MAs remain much higher.
🔹 Support: $130, then $124.80
🔹 Resistance: $139–145
🔹 Major overhead resistance: $166–170
A hold above $130 could open the door to a relief bounce. A break below $124.80 would raise further downside concerns.
Watch the levels—not the noise.
Follow for more technical analysis and trading setups.
#SKHY #SKHynix #Semiconductors #TechnicalAnalysis #Stocks

📉 $GOOG Intraday Update: The Bulls Have Work to Do.
Google is down 3.31% at $319.99 in the screenshot, trading below its key short-term moving averages. Momentum remains weak, and the $314.69–$320 zone is the level to watch.
🔹 Support: $314.69–$320
🔹 First resistance: $327–$331
🔹 Major resistance: $340–$343
A hold could trigger a relief bounce. A clean breakdown could extend the selloff. I want to see price reclaim resistance before calling a reversal.
Follow for more technical setups and market insights.
#GOOG #Google #TechnicalAnalysis #StockMarket #Trading

📉 $NVDA Intraday Update: Bulls Need to Reclaim Key Levels
NVDA is trading at $212.27, down 4.37% in the chart snapshot. Price is below the 5-day, 20-day, and 50-day moving averages, signaling continued short-term pressure.
🔹 Support: $208–210
🔹 Resistance: $218–220, then $224–230
Holding support could trigger a relief bounce. A breakdown may expose $196–200. Watch price action and volume before calling a reversal.
#NVDA #NVIDIA #StockMarket #TechnicalAnalysis #Trading

🚨 $MU Intraday Update: Bulls Are at a Critical Crossroads.
Micron is trading at $863.49, down 5.49% in the screenshot. The technical picture has weakened significantly, with price below the 5-day ($967.82), 20-day ($1,050.42), and 50-day ($916.47) moving averages.
📉 Key levels to watch:
• $850 — immediate support
• $800–$820 — stronger support zone
• $900–$920 — first major resistance
• $950–$1,000 — next upside target if momentum returns
My take: Holding $850 could set up a relief bounce, but bulls need to reclaim $900–$920 to improve the short-term structure. A breakdown below $850 would raise downside risk.
Follow me for more real-time market breakdowns and trading setups!
#MU #Micron #Stocks #TechnicalAnalysis #Semiconductors #NASDAQ

🚨 $SPCX INTRADAY UPDATE 🚨
SpaceX is trading around $150.06, down 5.81%. After a sharp pullback, the stock is testing a critical support zone — and the next move could set the tone for the short-term trend.
📈 Bullish scenario: Hold $150 and reclaim $155–$160 with strong volume, opening a potential path toward $175–$180.
📉 Bearish scenario: Lose $150, then break below $140, and the $120–$130 zone could come into focus.
🎯 My take: The chart is at a key decision point. I’m watching whether buyers can defend support and restore momentum. No need to chase — let price action and volume confirm the direction.
Are you bullish on SPCX here, or expecting another leg down?
Follow for more real-time market updates and technical breakdowns.
#SPCX #SpaceX #StockMarket #TechnicalAnalysis #Trading #MomentumStocks #WallStreet
