

We provide a high quality of performance analysis of your golf game to develop a time/effort balanced package to help achieving the best performance ⛳️
Joined May 2020
- Tweets33
- Following89
- Followers19
- Likes67





This great movie based on a true story has shown and proven that it’s all about the “deep” analysis of the stats and not only having them! @PGATOUR is providing great stats but it’s down to a player and his team to analyze them properly!!

..In the @jordanspieth Series it was mentioned that his irons are not as good as 2015, also from the fairways! ...Missing on the short side too and accordingly his scoring average is suffering! This hole #13 of round 3 at the @pgachampionship is one of the examples showing that.

Part 9 and last of the @jordanspieth series. Jordan’s struggle with the irons made him having too many putts from a longer distance (i.e. > 25 ft) and although his holing % was impressive, he was still losing 0.57 shots per round! So, the absolute frequency has to be considered!

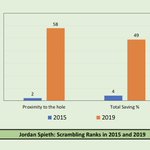
Part 8 of the @jordanspieth series. Losing ground in the two most relevant scrambling ranks is just a consequence of struggling with the irons. Despite Jordan’s great putting, being further from the hole, and probably missing too many greens on the wrong side too was a problem!

Part 7 of the @jordanspieth series. Here you can see a rankings comparison of the approach shots in ‘15 (best) and ‘19 (worst) on the @PGAtour Loosing so much ground in rankings shows actually how Jordan was struggling with the irons and wedges, while hitting from the fairway!

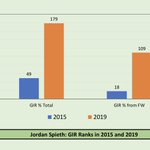
Part 6 of the @jordanspieth series. This GIR diagram shows how much ground Jordan lost. This is not only related to his drop in the driving performance! His GIR% from the FW has dropped massively as well. A clear indication that also his iron play has suffered compared to 2015.

Part 5 of the @jordanspieth series. Unfortunately Jordan lost ground in distance rankings which was not compensated by being more accurate! In 2019, he hit 18% less fairways than in 2015 (almost 6 fairways less per 4 rounds) which clearly has a direct impact on GIR and his score.

Part 4 of the @jordanspieth series. A clear improvement of Jordan’s putting from 5-10 ft and 10-15 ft and also > 25 ft, where his average of putts holed is 10.37% 👌🏻 .is just impressive. He was the best putter in 2019 on the @pgatour and had his best putting performance ever!

Part 3 of @JordanSpieth series. Did you also think Jordan’s drop in performance had something to do with his putting? Wrong! His putting in 2019 was better than his best year (2015) and he was the best putter on the @pgatour in 2019! More details will be posted in part 4.

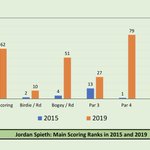
Part 2 of the @jordanspieth series. Here are his rankings in the main scoring categories in 2015 & 2019. It’s very obvious that his scoring suffered due to playing more bogeys or worse, mainly on par 4s but also on par 5s! Will be diving deeper into the “WHY“ @pgatour

Part 1 of @JordanSpieth series. Trying to show why his performance in 2019 was not as good as in 2015 @PGATOUR ...Starting here with some general facts! #golf #performance #analysis #stats #efficiency #optimize #getbetter #pgatour #europeantour #majors #jordanspieth

This is an absolutely new method to show the putting performance (10-15 ft) of @PGATOUR players. The bell curve shows that few players are doing great and few are showing poor performance! The first step for the designated player is to get into the right half of the Y zone!

Dr. Foos Golf Performance Analysis retweeted

Hitting bombs in Adamstal 🚀 looking forward to getting the tournament started tomorrow 🙌🏼@EuropeanTour @Challenge_Tour
It’s unfair that the media makes 🇺🇸 look bad during the #COVID19 crisis and blame @realDonaldTrump Fair is: to compare 🍏 with 🍏! The 🇺🇸 is #9 in the total deaths/1M behind many countries in Europe!!! And #12 in total cases/1M! 🧐@DonaldJTrumpJr @TeamTrump


In 2006 @TigerWoods won 8 times (incl. 2 majors). He was impressive from 175 to 200y! 20% more GIR, 7.5 ft closer to the pin and scored 0.2 per attempt better than the rest of the @PGATOUR players (i.e. a gain of approx. 2 shots per tournament) #Tiger #PGA #Golf

Tiger vs. Rory! A little comparison between Tiger and Rory. Tiger won two majors in 2006 as did Rory in 2014. Tiger’s iron game was off the charts! @TigerWoods @McIlroyRory @PGATOUR @GolfChannel #performance #golf #tiger #rory #majors

Interesting chart showing the performance of a top @PGATOUR player in all stat categories. Top one is a bad season and the bottom is a good one! Ideally you want to be below the line. The line represents the tour average.

The putting per GIR is one of the most important stats. This is an example of two @PGATOUR players shows the improvement potential in each round.

SG is a nice tool to compare performance. But take a close look to the SG ranks and the “actual” score average of @henrikstenson @ScottPiercyPGA @PRodgersGolf @DomBozzelli @b_dechambeau ...things don’t really match! The weight of each SG part needs to be revised @MarkBroadie 🤔

2 players, both played 21 events with no wins in 2019 on @PGATOUR show a difference of 0.9 shots in the scoring average and $2,000,000 in the price money. So, 0.1 shot = $220,000 ...for players within the top 5, the impact of 0.1 shot difference is even higher.