

Breast Cancer Survivor, trader
Houston, TX
Joined October 2010
- Tweets9.9K
- Following303
- Followers4K
- Likes42.1K


Rose 🌹 retweeted

Weekly Indexes: I've posting this chart every few weeks. I continue to have a short side bias until the SLOW line on the 3/10 osc dips well below zero. There might be short term day trades or 1-2 day trades to long side, but as my Texas friend says: "Man who picks bottoms ends up with stinky fingers".

Rose 🌹 retweeted

Not too long ago, I was trading a <$10K account. If I can do it, you can too.
Take your time - there is no rush. Do not approach the market with a scarcity mindset. Do not compare PnL or results with me or anyone else.
Most importantly, work on yourself. YOU are the final boss, not the market!

Rose 🌹 retweeted

Hard truth: your trading strategy probably works fine, you just can't sit still while it does.

Rose 🌹 retweeted

I see traders get frustrated all the time because they made $300 on a move that eventually could have paid them $1,500.
I’ve never understood why we spend so much energy being disappointed in profitable trades.
You identified an opportunity, managed your exposure, executed your plan, and walked away with money.
That’s a successful transaction.
The fact that the market kept moving after you exited doesn’t change that.
Learning to be satisfied with consistently extracting a small portion of a larger move can completely change how you approach this business.



Rose 🌹 retweeted
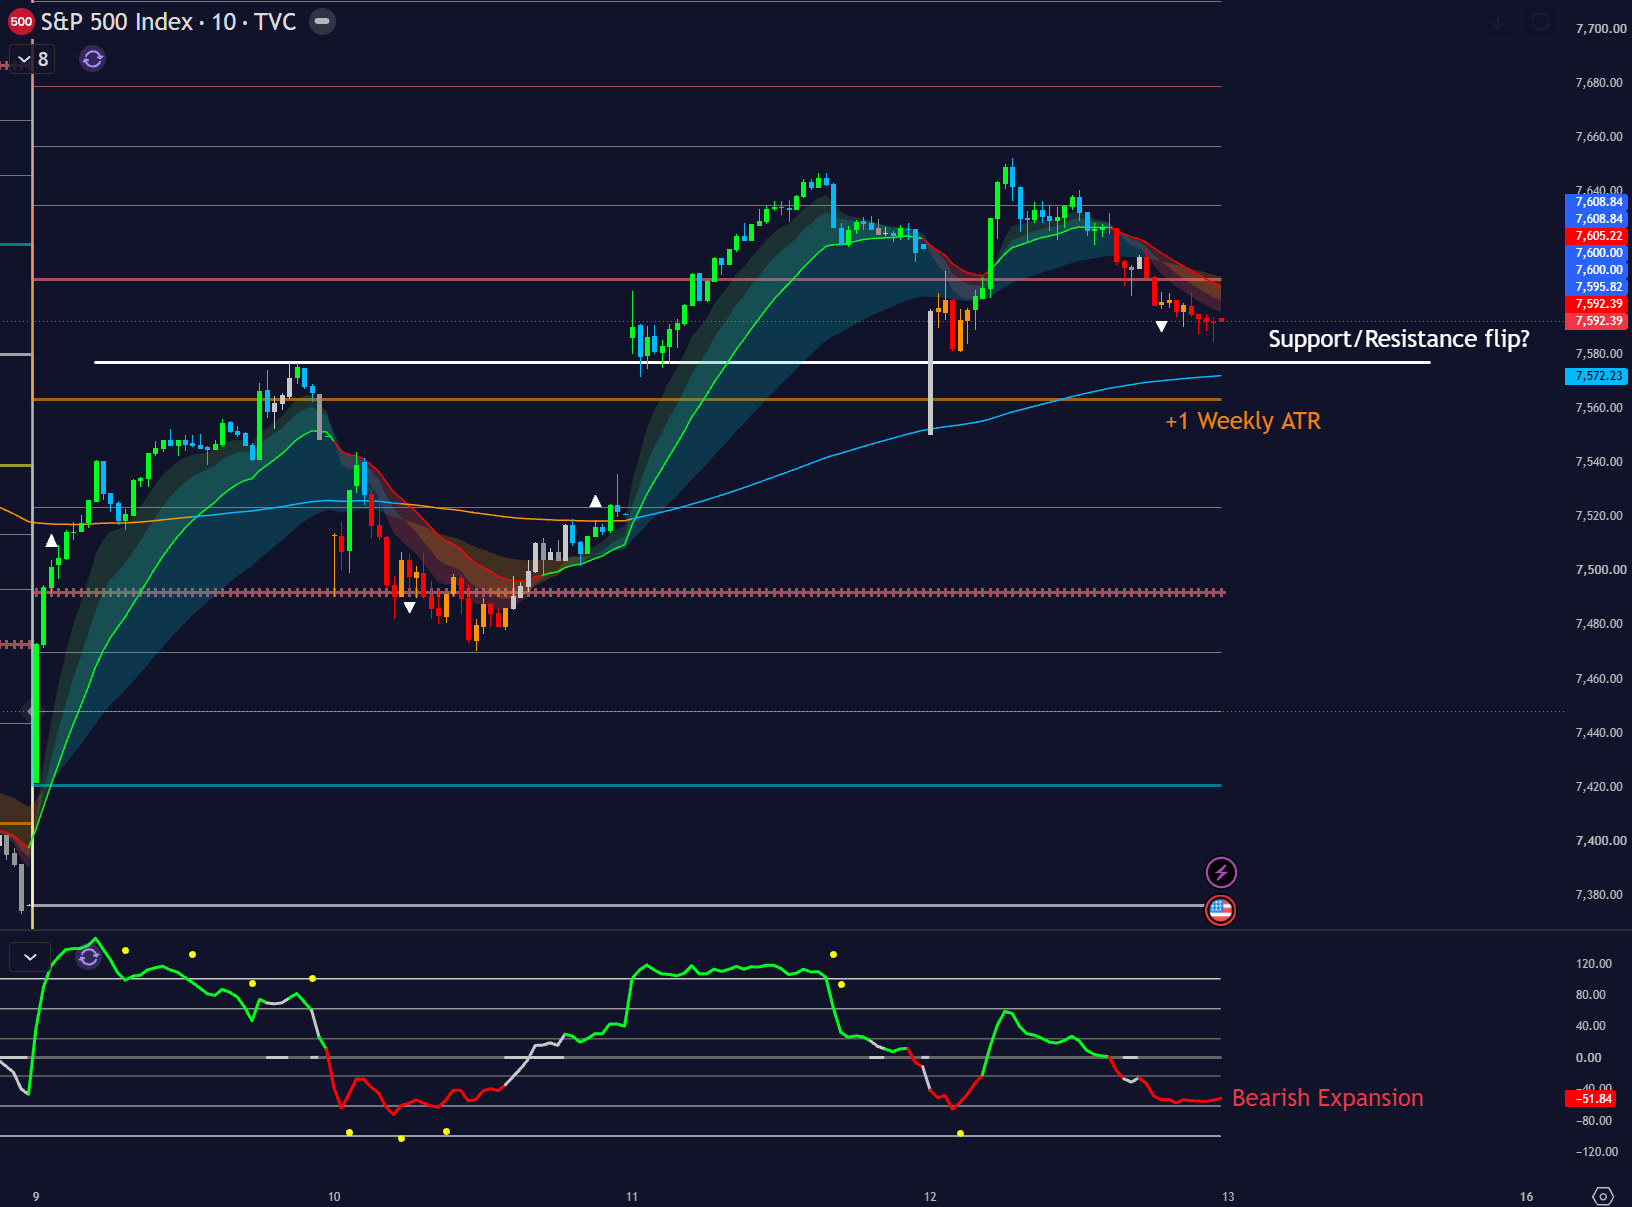
**Post-market SPX Analysis - 11/12/26**
Chart 1: hourly candles, monthly ATR levels
Chart 2: 10 minute candles, weekly ATR levels
SPX is at a major decision point IMO. Price is "pinched" between major trendlines, levels, and EMAs.
*The most important level in my mind is 7580*. This is the "golden fib" retracement of last week's drop, the monthly ATR pivot, and the hourly 21 ema (RTH).
Bearish price action today. Rallied in the morning and made a 2nd attempt at recovering the 0.786 retracement of last week's drop.
We rejected and put in a double top, then sold off for the rest of the day
We lost the daily 21 ema (important level), however the hourly 21 ema and monthly pivot are below as support
At a more tactical level (chart #2, 10 minute bars), 7580 was resistance on Monday but support over the last 2 days. We opened below it today, but price couldn't recover that level fast enough.
So we basically have a bearish bias and structure on the daily chart, and a bullish bias and structure on the hourly chart.
The way I see it, the two timeframes are not in agreement. Something's got to give, and I favor the higher timeframe winning over the lower one.
If we lose 7580, I would not be surprised to see an "elevator down" sell down to 7500
7500 is the monthly "put trigger" ATR level - very important. Below that we have supports at:
- 7470 (Tuesday's low)
- 7440 (the 0.236 retracement) -- at this level we open a "Golden Gate" play down to 7360 (!)
- 7400 (the -0.5 Monthly ATR level)
Bulls need to recover and hold above 7610, then 7640 for any hope of avoiding a meltdown
Bears have one job which is break and hold below the all-important 7580 level.
Worst case scenario for me is continued chop between the 7580 and 7610 - could see some very annoying price action until we decisively break either level



Rose 🌹 retweeted
Naw....we ain't anywhere close yet to a portfolio buying opportunity. (Need to see width of the green zone)

Rose 🌹 retweeted
Some trading days reward you with profits.
Others reward you with wisdom.
Both have value—if you're disciplined enough to learn from them.




Rose 🌹 retweeted
7600-7500 demand being tested on $SPX. W21 key pivot to continue to watch. Typically a weekly close below W21 has signaled more downside in recent years. We stayed above it after October window dressing. If tech bounces look for gap fill. Under 7500 we have lower demand to test near 7400-7300.
AAPL ER and US Midterm elections on deck (I expect divided government with a flip of House/Senate). NFP Friday.


FOMC rate decision (likely a hold), Warsh, PCE, GDP and tech ER on deck this week.
Same thoughts as last week. Lost the $SPX quarterly pivot. Looking for demand between 7600 and 7500 with the key W21 pivot between. Under 7500 we can test lower demand. 7760 remains key upside resistance.

Rose 🌹 retweeted

The desire to "get rich quick" on 1 trade prevents most traders from ever doing so.Wealth comes from compounding gains over a year. My account never grew until I was happy with a few points a day *avg* in #ES_F. Compounded & scaled over 250 trading days a year, its transformative
Rose 🌹 retweeted

youtube.com/@insidebarbandit…
Make sure to like and subscribe to my YouTube channel. Soon, I’ll have a lil more free time and I plan on adding more content. Considering weekly watchlists along with more educational videos.
