

Born and raised in Gainesville (ACR). data scientist working in a boring industry, so doing this on my free time, not affiliated with the university.
Joined April 2025
- Tweets1.6K
- Following619
- Followers7.5K
- Likes8.9K




Pinned Tweet
Man, if Auburn can beat Georgia here, we’re going to have one of the biggest transitive Circles of Chaos in a while.

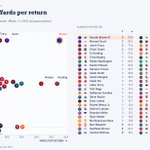
VB3 hasn’t returned a punt in over a month and has missed the last 3.5 games, yet he’s still the best punt returner in the country. 🐊

Despite having an historically inconsistent offense, through seven games, they have performed really well relative to previous Florida offences
(though I imagine the first four games are doing most of the heavy lifting in these averages).


How many players have recorded their individual season highs against each SEC defence this year
Includes QBs, RBs and WRs who have played at least 4 games this season

A season high doesn’t necessarily mean a great performance.
Auburn has allowed 3 RBs to record season-high rushing totals:
Bishop (Tennessee): 220
Baugh (Florida): 162
Pendergrass (Baylor): 88
Florida has allowed 2 QBs to record season-high passing totals:
Simmons (Missouri): 340
Brown (Auburn): 271
And Florida had the biggest improvement in EPA per play allowed of any SEC defense in Week 7.
EPA measures how much each play changes an offense’s expected points.
We went from allowing +0.13 per play to -0.13 against Texas, meaning we were consistently putting Texas in worse scoring positions 🐊

Most improved SEC offenses in Week 7:
Comparing each team’s week 7 numbers vs weeks 1-6 avg
Total yards: Texas A&M (+168.2 yards)
Rushing yards: Ole Miss (+123.8 yards)
Worth noting that Texas A&M played The Citadel.


Most improved SEC defenses in Week 7:
Comparing week 7 vs weeks 1–6 avg, Florida led the SEC in improvement in two categories:
Third-down conversion rate allowed: 46.7% → 20.0%
Havoc rate (sacks, takeaways, and runs stuffed): 10.5% → 20.0%
Gotta continue to be more aggressive on defence!


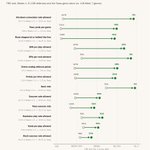
Florida improved across 13 defensive metrics against Texas compared to its first six games.
The chart shows FBS defensive rankings from weeks 1-6 vs ranking based solely on week 7.
Some INCREDIBLE jumps in the rankings:
- 3rd-down defense: 127th → 5th
- pass yards allowed: 131st → 30th
- EPA/rush allowed: 95th → 9th
- PPD allowed: 106th → 32nd
- Sack rate: 53rd → 3rd

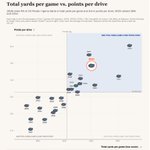
Only taking into account the SEC games so far this year:
Chart 1: total yards vs points per drive (offensse)
Chart 2: total yards and PPD allowed (defense)
Florida on opposite ends of the spectrum (top right best teams for both charts)


Proof I don’t always post Florida-flattering stats. Look what Napier did to us.
SEC over- and underperformers from 2021–2025, based on preseason vs. final SP+ and FPI ratings.
Florida underperformed expectations by over 30% more than the next-worst SEC team.

🚨SEC Over- and Underperformers🚨
Comparing each team’s preseason SP+/FPI rating to where they stand through Week 7.
Kentucky and Mississippi State have exceeded expectations the most, while Vanderbilt, Texas A&M, and Oklahoma have fallen the furthest.


Again, crappy video quality, did my best to clean it up.
Also i think Kentucky was coming off an historic win against top ranked LSU


SEC teams ranked by “middle 8” scoring margin.
Bama leads the way, followed by Kentucky (Stein turning out to be a big hire).
Poor Arkansas bringing up the rear. Surprised to see Georgia and Texas negative as well.

