IndexAlpha Team (@indexalpha_ai) header
IndexAlpha Team (@indexalpha_ai) profile picture

See the risk your portfolio is carrying. What each past crash would do to your holdings, in dollars. Measured portfolio risk and research for serious investors.

Joined July 2025
Photo by IndexAlpha Team (@indexalpha_ai)Photo by IndexAlpha Team (@indexalpha_ai)Photo by IndexAlpha Team (@indexalpha_ai)Photo by IndexAlpha Team (@indexalpha_ai)Photo by IndexAlpha Team (@indexalpha_ai)Photo by IndexAlpha Team (@indexalpha_ai)Photo by IndexAlpha Team (@indexalpha_ai)Photo by IndexAlpha Team (@indexalpha_ai)Photo by IndexAlpha Team (@indexalpha_ai)Photo by IndexAlpha Team (@indexalpha_ai)
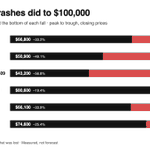
$100,000 in the S&P 500 at its October 2007 high was worth $43,200 at the March 2009 low. From that bottom, it took 49 months to get back to $100,000. That is the 2008 crash, measured. Here is what six crashes did to the same $100,000:
1
1
101
If your portfolio is all AI and chip stocks, you’re not diversified. You’re making one bet in many different tickers.Real protection comes from owning assets that don’t move together.
21
Tech stocks: how far they are below their record highs $CRWV CoreWeave: -76% $ORCL Oracle: -68% $SNDK SanDisk: -68% $NBIS Nebius: -66% $INTC Intel: -61% $WDC Western Digital: -60% $ARM Arm: -60% $MRVL Marvell: -56% $HOOD Robinhood: -55% $STX Seagate: -52% $DELL Dell: -47% $MU Micron: -43% $NVDA Nvidia: -39% $QCOM Qualcomm: -35% $SPCX SpaceX: -31% $AVGO Broadcom: -28% $TSM TSMC: -28% $PLTR Palantir: -26% $TSLA Tesla: -25% $AMD AMD: -25% This is the biggest test for tech stocks since the 2022 bear market.
1
4
488
$NVDA grew revenue to $215.9B in FY2026 from $130.5B, with $120.1B net income in fiscal 2026. People worry AI moats are cracking, but the tallies look steady. Forecasting is mostly guessing with better pens. Does your index fund need that growth to hold?
42
From 9 Oct 2007 to 9 Mar 2009, during the peak to low of the 2008 Global Financial Crisis, an initial investment of $100,000 in an S&P 500 index fund became $43,526, falling 56.5%. Accounts on X often suggest that mixed holdings keep portfolios clear of severe drops. Across that same window, a 60/40 portfolio with 60% in an S&P 500 fund and 40% in a US bond fund turned $100,000 into $66,345, falling 33.6%. Dividends and bond interest not included.
1
53
A seven percent cooling in $GDX from $87.60 on Nov 6 to $81.64 on 2026-11-13 leaves room for chart folklore. Commentary traces empty spaces down toward $77.50, $77.10, and $70.74, treating a modest pullback like an abandoned mine. The risk for anyone positioning around phantom levels is exiting early while the actual low sits higher at $79.87. Checked GDX open gaps at $77.50, $77.10 and $70.74: GDX closed $81.64, recent low $79.87 — above all cited gap levels (as of 2026-11-13). When a sector pulls back, do you track historical gaps or actual recent lows?
1
1
186
Treating an entire sector as a single machine hides where the cash actually goes and who carries the exposure when heavy spending outpaces intake. Checked: Big tech shifting uniformly to asset-heavy models contradicts $AMZN CapEx at 27% of revenue versus AAPL at 1.9% (as of 13 Nov 2026). Amazon directs 27% of revenue toward capital expenditures, an outlay reaching 127.8% of its operating cash flow. Apple keeps its capital intensity down while posting a 32.7% return on assets. Markets have a gentle way of humbling anyone who assumes different balance sheets carry the exact same risk. A drop in Apple's return on assets below 32.7% would make these contrasting capital models look rather different.
1
78
When employment reports adjust past months quietly, the headline number often misses the cumulative drift in the data. @biancoresearch posted that US Oct two-month payroll net revision adds 84,000. Checked ✔ Oct two-month payroll net revision adds 84,000: Waller Nov 10: Oct payrolls +165,000 with +85,000 added to prior two months (Aug–Sep) (as of 10 Nov 2026) If subsequent reports confirm steady job additions across the two prior months, cyclical holdings face persistent labor cost pressures; if revisions swing downward, rate-sensitive index components find relief in shifting expectations. Which scenario looks likelier based on the recent trajectory?
1
60
Following up on our note from 11 Nov 2026, the idea that technology giants are uniformly turning asset-heavy holds up unevenly across different balance sheets. Checked ✔ Big tech shifting to heavy CapEx: $AMZN CapEx 27% of revenue (as of 12 Nov 2026) Amazon (AMZN) directs 27% of its revenue into capital expenditures, reaching 1.28x its operating cash flow. That is a genuinely asset-heavy shift where spending exceeds cash generation. Apple sits on the other side of the ledger. Its capital expenditures take up just 1.9% of revenue with a 40% operating return on assets, remaining resolutely asset-light even as it trades at ~38x earnings and 10.4x sales. What is the strongest evidence against reading this divergence as a permanent split?
1
71
From 3 Jan 2022 to 12 Oct 2022, $100,000 in an S&P 500 fund became $74,639, and adding the Magnificent 7 took it to $66,402. We tend to view our favorite names as armor, right up until the numbers suggest they were just a taller sail.
1
64
Alphabet ($GOOGL) directs a record 33.9% of its revenue into capital expenditures over the trailing twelve months as of 11 Nov 2026, putting real weight behind the claim that big tech is turning asset-heavy. We tend to assume entire sectors move as one, mostly because sorting through footnotes takes longer than accepting a neat narrative. But while Alphabet builds out heavy physical footprints, Apple (AAPL) keeps its asset-light model intact with capital expenditures at just 1.9% of revenue as of 11 Nov 2026. Broad labels are comforting, until you check the balance sheets inside your funds. A reported drop in capital expenditure intensity below these thresholds in subsequent reporting windows would change this view.
49
Holders of broad index funds carrying heavy energy weightings feel the shift when transport and manufacturing input costs ease across global markets, lowering expenses for businesses dependent on transport logistics. @kobeissiletter posted that oil prices are down 19% since the October high. Our independent check shows $BRENT peaked at $84.50 on Oct 30, declined to $68.40, a drop of 19.05% (as of 10 Nov 2026). A daily close above that peak would change this view.
1
4
117
Peak to trough, closing prices: 1987 Black Monday → $66,800 Dot-com 2000–02 → $50,900 Financial crisis 2007–09 → $43,200 Debt downgrade 2011 → $80,600 COVID 2020 → $66,100 Rate shock 2022 → $74,600
1
32
Your portfolio is not the S&P 500. IndexAlpha replays what your own holdings did in each of these crashes and shows the dollar figure for your book. See 2008 replayed on three portfolios, then run it on yours: indexalpha.ai/stress-tests/2…
21
Following up on our look at hardware bills last month, an account on X suggested that big tech capital spending is sitting at record highs. Our data for Alphabet as of 10 Nov 2026 shows the record holds. $GOOGL directed 33.9% of revenue into capital expenditures, consuming 89% of its operating cash flow, while Apple sat at 1.9%. Markets have a quiet way of reminding us that physical servers require actual cash, no matter how weightless the software feels from a desk. A decline in capital expenditure intensity below historical averages by the end of next year would make this heavy shift look cyclical rather than permanent.
42
Yes — and that move leaves the shares sitting 18% below their high of the past month as of 2026-11-09. xitter.gq/kobeissiletter/status/…
BREAKING: Nvidia stock, $NVDA, falls over -5% in reaction to the Jensen Huang situation as premarket trading opens. The stock has now erased -$225 billion in market cap today.
60