

Designing dbt Charts · Senior Principal Data Graphics Designer & Engineer · Author of Info We Trust · Chartography
- Tweets11.1K
- Following392
- Followers10K
- Likes18.1K






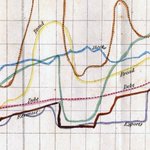


ALT V Robinson The Lent Bumps 1931 - 1940 Pen, ink and watercolour 60 x 48 cm A hand-painted chart illustrating the results of the Lent Bumps from 1931 to 1939, with a note that in 1940 there were 'No Lent Races due to War'. The Lent Bumps, also known as "Lents" or the Lent Races are a set of University of Cambridge rowing races held each year on the River Cam. The races are open to all college boat clubs from the University of Cambridge, the University Medical and Veterinary Schools and Anglia Ruskin Boat Club. The Lent Bumps take place over five days (Tuesday to Saturday) at the end of February / start of March and are run as bumps races (of rowing race in which a number of boats chase each other in single file, each crew attempting to catch and 'bump' the boat in front without being caught by the boat behind). The men's races officially began in 1887 and the women's in 1976. https://www.1stdibs.com/art/drawings-watercolor-paintings/v-robinson-cambridge-rowing-lent-bumps-1930s-chart-pen


ALT Geologic map with six cross-section diagrams of geologic layers and legend information on the left and right sides of the page.


