

ETF structure, quant investing, and portfolio construction. Charts without the rocket ship emojis.
Joined April 2011
- Tweets26
- Following312
- Followers605
- Likes11





Pinned Tweet
Annual leadership changes more than most portfolios do. Diversification works because no asset stays on top for long.

Real returns by decade since the 1870s.
US stocks: +6.66% per year after inflation over 155 years.
Bonds: +1.92%. Gold: +1.01%.
So far this decade, gold has the lead.

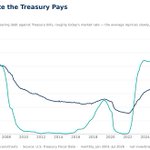
The US yield curve has been inverted in only 12% of months since 1840.
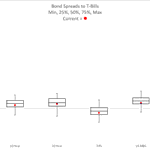
• Term spread today: 0.99%
• Baa over Aaa: 0.44%
• Baa over Treasuries: 1.18%

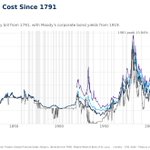
The US 10-year Treasury yield, 1791–2026.
235 years of monthly data.
Peak: 15.84% (Sep 1981)
Trough: 0.55% (Jul 2020)
Today: 5.24%
Most versions of this chart start in 1962. The other 171 years exist.


How long US stocks spent below their previous peak, 1871–2020.
• Longest single stretch, nominal: 7 years (1929–1935)
• Longest single stretch, real: 13 years (2000–2012)
Jordà-Schularick-Taylor annual returns

What investors demand to own stocks, by country.
The US sets the floor at 4.42%. Every country is the US plus a charge for its own sovereign risk.
10 countries sit on that floor exactly. 28 are above 13.0%.
Same asset class.

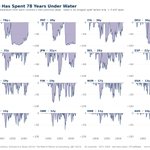
Most long-run stock charts show a line going up. Here is the same data displaying time spent NOT recovered, real drawdown from the previous peak, 16 countries, 1871–2020.
Longest stretch below a previous peak: France, 78 years and counting.
Median country: 20 years.
United States: 13 years.
2 of 16 are below a previous peak right now.

How long an equity factor can pay you nothing.
Longest stretch where the trailing 10-year premium was negative, since 1973:
Growth beat value for 11 years 10 months — and still is
Large caps beat small for 11 years 2 months
Losers beat winners for 9 years 8 months
Aggressive beat conservative for 3 years 2 months — and still is
Cash beat the market for 3 years
Unprofitable beat profitable for 2 years 8 months
That includes the market itself.

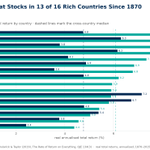
Since 1870, across 16 advanced economies:
Housing returned 6.1% a year after inflation.
Equities returned 4.8%.
Housing won in 13 of 16 countries.
The US is one of 3 where it didn't: stocks 6.7%, housing 5.8%.

The 10 largest stocks are 38% of the S&P 500.
But they account for 56% of its risk.
In 2010, those figures were 16% and 18%.


Geopolitical shocks typically push yields lower.
Not when oil is driving inflation.
Oil leads. Inflation expectations follow. Rates adjust.


Equal weight doesn’t outperform in all environments.
Historically, its edge has been strongest when cross-asset dispersion is elevated.

