

Sports bettor? More like sports worsor amirite? I like to build math models for sports betting. Fan of the Manul, or Pallas cat, a small East Asian wildcat
Joined March 2025
- Tweets1.5K
- Following898
- Followers676
- Likes2.2K





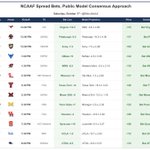


You guys remember how much time we used to spend aligning all the versions of team names across different databases?


Interesting question. The answer is they're not trying to give up, but definitely act more aggressively and therefore tend to do worse:
First-pitch swing rate, elimination spot: 37.8%, their normal rate: 28.4%
Strikeout rate: 26.3% vs 21.1%
XBH: 2.5% vs 6.9%
Pitch/PA: 3.68 vs 3.8


> Radar plots are bad because order matters so for the takeaway
> well what if you cycle through all possible orderings and take the average area, that’d make it a bit more robust/global score
> oh that’s essentially just regression


