

We curate the world’s most compelling maps to help you navigate topics affecting the planet and everyone who lives here. Submit your maps for consideration!
Redlands, CA
Joined January 2009
- Tweets1.6K
- Following712
- Followers2.2K
- Likes68







An extraterrestrial landscape exists in Idaho.
This map from Shira Ellenson and YoLani Martin highlights the otherworldly terrain found at Craters of the Moon National Monument and Preserve.
Learn more about it at maps.com/craters-of-the-moon…

In loving detail, Madeleine Ratcliffe at @esriuk illustrates the relationship between composer Smetana’s music and the Vltava River in Czechia.
Learn, watch, and listen for more: maps.com/vltava-river-map-co…
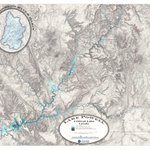
Lake Powell is a key reservoir for the southwestern United States. But here, both time and water may be running out.
Great cartography from Zach Beck at @MapUtah provides a closer look at this vital and fragile resource: maps.com/lake-powell-map-sho…


Track, explore, and learn about active and historic solar storms in a gorgeously interactive app.
CME Tracker by Mike DiCarlo combines data from NASA, NOAA, and GFZ to visualize coronal mass ejections in our solar system: maps.com/mapping-solar-storm…
New weekend plans just dropped:
✅ Make a new map using this tool
✅ Submit it to @mapsdotcom
maps.com/submit-map/


Phosphor uses the oklab color space to accurately represent color. But it also supports CIE LAB, HSV, RGB, and other methods if you prefer them.
It makes my data viz work easier, and I hope it helps you too.
joshuastevens.net/phosphor/
Last year, more than 36,000 people lost their lives in motor vehicle accidents. And some locations are deadlier than others.
We've mapped America's deadliest intersections. See the full list at: maps.com/deadliest-intersect…
mapsdotcom retweeted

maps.com/joseph-kerski-on-sp… Thank you @mapsdotcom for this opportunity to speak with you and your community about issues that really matter.

Educating with Maps: We sat down with @josephkerski for a wide-ranging discussion about geography and spatial thinking.
Check it out!
maps.com/joseph-kerski-on-sp…

Wildfires can, and do, occur all over Earth. But they’re starting to happen more frequently in places where they haven’t historically occurred as often.
Learn more via intuitive maps from @NASA’s Earth Observatory: maps.com/wildfires-maps-trac…


How have carbon dioxide emissions changed over the past century?
As Earth warms, in part due to these emissions, scientists continuously monitor CO2 levels and where they originate.
See the full animation at maps.com/global-carbon-emiss…
Scientists say a record-breaking El Niño is in development. And Sea Surface Temperature Anomalies in the Niño 3.4 region show no sign of slowing down.
Track Sea Surface Temperatures and Anomalies, Air Temperature, Aerosols, and other environmental metrics in near real-time with Earth in Action.
maps.com/earth-in-action/

Heatpeaks, by Benjamin Barthole, uses historical and hourly data from Météo-France to highlight heat anomalies across France.
And it does so by treating temperature anomalies as an elevation surface.
maps.com/france-heat-wave-ma…


The craft of making maps has become easier than ever due to digital programs and tools. But people still have a key role to play.
We recently discussed the human element of cartography with Wes Jones: maps.com/cartographer-wes-jo…

When do people list their homes for sale? It depends on the season...and the place.
Aziz Sunderji produced a new map with data from @Redfin to show how much real estate listings in each county are affected by seasonal swings.

Learn more about this fantastic map and the implications of this work:
maps.com/map-shows-seasonali…

Fires in North America, Africa, and Asia. Dust crossing the Atlantic. And Typhoon Dolphin barreling towards China.
Our planet is always in motion, and these are just some of the things we can see with Earth in Action.
Watch animated maps of air and sea surface temperatures, aerosols, and even recent earthquakes.
maps.com/earth-in-action/
Your map deserves more than a quiet corner of your portfolio. We're looking for beautiful, clever, surprising, and impactful cartography to share with map lovers around the world.
Put your work in the spotlight!
maps.com/submit-map/