

Knowledge design studio. We bring together research and design, data and storytelling, analysis and engineering.
Joined May 2026
- Tweets67
- Following111
- Followers34
- Likes551






How do you move an 83-tonne statue without cranes, trucks or even oxen?
Ancient Egyptians had a solution: human resources. Lots of them.
mrdn.world/ramesses-the-grea…
Our new project started with an 80-tonne granite sculpture in Frankfurt. Along the way, we made a mathematical discovery.
Explore the discovery, follow the sculpture’s 5,000-kilometre journey and examine our 3D models in the interactive story: continuity-maxbill.mrdn.worl…
Our project, Toward Kontinuität, exemplifies what we do for cultural institutions: combining research, visualisation, and technology to make complex cultural heritage accessible to wider audiences.
continuity-maxbill.mrdn.worl…


We’re starting a new research project to test how accurately leading AI models understand corporate reports. Can they extract the right financial figures? Explain a company’s strategy?
Stay tuned for updates!

When the Grand Egyptian Museum opened in Giza in 2025, Ramesses II was already waiting inside. It was the first artefact registered in the collection: GEM 1.
Read our feature story about it: mrdn.world/ramesses-the-grea…
A 57% market crash and a 34% crash can look similar when each sits in its own chart. Good financial communication needs context.
We put major market crises on the same scale: the 1970s shock, Black Monday, the dotcom bust, the 2008/09 crisis and COVID.
wall-street-rodeo.mrdn.world

Meet Méridien Reporter, our new tool for corporate reporting.
We create interactive reports that let users ask questions, explore data in different formats, and personalise content.
Watch our short demo to see how it works.
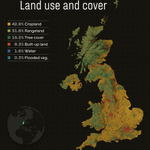
Britain is much less built-up than it looks from the train.
Mapping the land-cover dataset shows regional differences: for instance, farmland dominates eastern England.
This is the kind of work we do at Méridien: finding a clear picture inside complex data.

$100 invested in the S&P 500 in 1987 would be worth more than $6,500 today.
Pick any year. Pick any amount. See what decades of booms, crashes and recoveries would have done to your money.
Try it: wall-street-rodeo.mrdn.world

MRDN Méridien retweeted

A day of public transport in Dubai, in 40 seconds. Made for @mrdnworld using recorded bus and boat positions and published metro and tram timetables.
#Dubai #PublicTransport #DataVisualization #UrbanMobility #TransportData
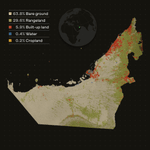
What does the UAE look like when you map how its land is used?
Our visualisation uses satellite data from 2024, broken into 10×10 metre cells. Nearly 6% of the country is classified as built-up land.

We went to New York, captured the Charging Bull on location and used the footage to build our own 3D Gaussian splatting scene.
It gives the story a physical place before we move to financial markets, crashes and decades of financial data. See it here: wall-street-rodeo.mrdn.world
We charted the S&P500 from 1973 to 2026, showing decades of growth through downturns and recoveries.
Good financial communication needs that kind of context. A number becomes useful when you can see its scale and how it changed over time.
wall-street-rodeo.mrdn.world

Where do you start when telling the story of 70 years of Wall Street crises? For the Wall St Rodeo, we started with a bronze bull.
The project brings together financial research, interactive data visualisation, maps, 3D models and our own 3DGS scene.
wall-street-rodeo.mrdn.world
How do you turn a full day of Dubai public transport into a 40-second video?
We built a minute-by-minute record of Dubai’s buses and boats: 947,781 positions from 1,197 different buses, plus 16,000+ boat position records.
MRDN Méridien retweeted
Our first Dubai flood model was wrong, with pools 20m deep and water moving at 21m per second. So we found the problems and fixed them. Now, it shows what actually happened on the ground.
That is our approach: build it, test it and keep improving it until it becomes useful.
MRDN Méridien retweeted
Balady Atlas has published "Hajj and Umrah in Data", and a large part of this one is my work.
It is a longread about the pilgrimage in numbers. Who gets to go, and how the quotas are split between 165 countries. Why Umrah is 10 to 15 times the size of Hajj. Why the dates drift through the seasons on a 33-year cycle, what that does to the heat in Makkah, and what Saudi Arabia builds against 48°C.
My part: the research, the script, and a working prototype of every visualization in the piece, down to the transitions between them. Shortly - the whole visual storytelling. Then it went into the hands of the guys of our team. That is where it got its final form and the speed it runs at now. The scroll is smooth on a phone, the scenes load without a stutter.
atlas.balady.gov.sa/en/hajj-…
MRDN Méridien retweeted
Here is one visualization in Hajj and Umrah in Data I am especially proud of: the Islamic calendar and the temperatures on the days of Hajj, drawn as a spiral.
What I like most about it is that the form, spectacular as it is, is doing real work here. The Islamic calendar is lunar, its year is 10 or 11 days shorter than the solar one, so the dates of Hajj move earlier every year and come back to roughly the same place after about 33 years. If you plot that against the months, the calendar really does make a spiral, there is nothing to invent. And once every Hajj on it is colored by the temperature in Makkah on those days (data from Open-Meteo), you can see the pilgrimage go into the summer and out of it, and you can see that the last turn is hotter than the one before: Hajj nights are 5 to 6°C warmer than 30 years ago.
The idea, script and interactive prototype of this one is mine, the production version is the @mrdnworld
MRDN Méridien retweeted

Good data viz appears constantly.
How much of it reaches you?
#DataViz Weekly is our regular pick of what we found most interesting.
This time:
◉ Hotter days by county 🇺🇸
◉ Passports compared 🌐
◉ Heat & hospital deaths 🇦🇹
◉ Hajj dates & Makkah heat 🇸🇦
anychart.com/blog/2026/09/11…

ALT Data Visualization Projects to See for Yourself