

Securities offered through LPL Financial, Member SIPC https://xitter.gq/t.co/n21zQ0jmmd
Syracuse, NY
Joined September 2011
- Tweets14.3K
- Following409
- Followers6.9K
- Likes29K


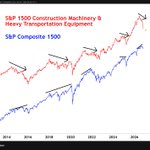


Thank you @CMTAssociation for including my work!

Chart of The Day: S&P 1500 Machinery & Heavy Transport Index Diverges @murphycharts
“The S&P 1500 Machinery & Heavy Transportation Index is an excellent leading indicator.
Net-new orders for heavy machinery often peak months before the broad market catches up.
Look at the last 10yrs of data: ahead of every major top, this sub-industry index rolled over and failed to form a higher high.
Cyclical names like $CAT, $PCAR, and $CMI are in their own respective bear markets. Drawdowns ranging from 20-40% from the cycle highs.”

10
566
When a client asks about an individual stock after a big run-up, I like to show them how far price sits above its 200-day moving average.
The 200-day is a common gauge of the long-term trend. If a stock is far enough above, it could fall 50-70% and still not violate the technical uptrend.
Pointing out that fact will often shift the focus of the conversation from “potential reward” to risk management. It opens the door to talk stop losses, position size and how the asset may or may not fit into their broader portfolio.
3
11
1,002

The S&P 1500 Machinery & Heavy Transportation Index is an excellent leading indicator.
Net-new orders for heavy machinery often peak months before the broad market catches up.
Look at the last 10yrs of data: ahead of every major top, this sub-industry index rolled over and failed to form a higher high.
Cyclical names like $CAT , $PCAR, and $CMI are in their own respective bear markets. Drawdowns ranging from 20-40% from the cycle highs.


Honored to be included!
Chart of The Day: A Bullish Engulfing Candle In Value vs. Growth @murphycharts
“A bullish engulfing pattern has formed on the Value vs. Growth monthly ratio, a setup indicative of positive short-term forward returns. Traders should anticipate follow through in favor of Value. $SPYV $SPYG.”

10
689
Shane C. Murphy, CMT, CFP® retweeted

Chart of The Day: A Bullish Engulfing Candle In Value vs. Growth @murphycharts
“A bullish engulfing pattern has formed on the Value vs. Growth monthly ratio, a setup indicative of positive short-term forward returns. Traders should anticipate follow through in favor of Value. $SPYV $SPYG.”


Shane C. Murphy, CMT, CFP® retweeted

A lot of folks who have been consistently wrong for the past two years are having a good day today.
Kalshi's latest marketing email, targeting NYC-area small business owners..
“Worried a snowy month will hurt your business? Place a bet on it."
Who out there actually knows a small business that hedges risk on Kalshi? Nobody. This is a gambling app trying to market itself as a financial tool to people who, honestly can't afford to lose. It’s gross.

