

Home of "Mr Breakouts". Algo Breakout Trading Specialists. Tips and strategies on algorithmic breakout trading. Disclaimer: https://xitter.gq/t.co/G4wi1ZckMa
Joined April 2018
- Tweets3.6K
- Following11
- Followers8K
- Likes1.1K





Pinned Tweet
One condition. No indicator. No parameter to optimize. It filtered 80% of bad trades from a NASDAQ breakout strategy.
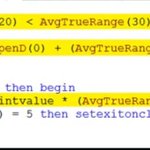
The condition: is the high of the entry bar above today's open?
That's it. One line of code.
If yes, the market has been trading above today's open. There's an established uptrend for the day. Enter the long breakout.
If no, the market is below today's open when your signal fires. You're not in an uptrend. You're trading noise. Skip.
Before:
- Net profit/drawdown ratio: 5.24
- Drawdown: ~$40,000
- Average trade: $120
After:
- Net profit/drawdown ratio: 7.97
- Drawdown: ~$25,000
- Average trade: $162
Net profit went up while drawdown got cut. That's the signature of a genuine filter. It's removing the right trades, not random ones.
Why does it work? Breakout trading is about momentum. If you're buying a breakout to the upside but the market has been trading below its open all day, there's a contradiction. The price level is breaking out, but the day's direction says otherwise. Those trades are the ones that chop you up.
No parameters means no overfitting. This is pure trading logic. You could test it on any long breakout strategy, on any market, in minutes.
The power isn't in complexity. It's in asking the right question.
What's the simplest filter you've ever used?

Breakout Trading Academy retweeted
I tested 100 filter conditions across thousands of breakout strategies.
One kept winning.
It was the slope of a moving average.
Not a crossover.
Not price above or below the average.
The slope itself.
Rankings:
- Out-of-sample: #1
- Robustness: #1
- Total score: #1
Then I checked other markets.
NASDAQ. Gold. Nikkei. Bitcoin.
Same result.
Why it works: a market can sit above its moving average and still be flat.
The slope waits until the average is actually accelerating.
That’s when breakouts have more conviction.
On crypto breakout strategies it improved net profit, drawdown, average trade, and win rate at the same time.
Most filters trade one thing for another. This one lifted multiple metrics together.
100 conditions. Four markets. One winner.
Save this. Full breakdown here:
breakouttradingacademy.com/t…
Breakout Trading Academy retweeted
I wanted to know which moving average truly works.
So I tested 100 indicators using professional-grade analysis.
Thousands of strategies.
15 years of Nasdaq 60m data.
Measured with uplift and robustness indexes.
The best results in the Moving Averages category came from:
✓ Triple Exponential Moving Average (distance from price).
✓ Moving Average Slope (20–50 periods).
These filters consistently improved profits, reduced drawdowns, and held up across unseen data.
The lesson: don’t guess.
Test and trust what’s proven.
Watch the video and get the free resource in the comments.

Breakout Trading Academy retweeted
Most traders fail prop firm challenges for one reason.
Their equity curve still has large drawdowns.
Prop firms usually want roughly 8–10% profit while keeping maximum drawdown near 10%. One or two strategies with bigger swings get knocked out, even if the overall return looks fine.
A small portfolio of low-correlation strategies fixes this.
Three opening-gap breakout strategies on E-mini Nasdaq (different sessions):
- Individual strategies had drawdowns that would fail most challenges
- Correlations between them were close to zero
- After removing the weakest days of the week and combining them, the net profit to drawdown ratio rose to about 13 to 1
- The equity curve became much smoother and more consistent
You do not need spectacular strategies. Average ones, properly diversified, already produce the steady profile prop firms look for.
This is the foundation. Risk sizing to stay under the drawdown limit comes next.
The full article has the exact setup and more context if you want to dig into it.
Save this. Full walkthrough of the approach and the three-strategy example:
breakouttradingacademy.com/h…

Breakout Trading Academy retweeted
I used to think DMI was not a great indicator to trust.
Then we made one change and it became a core part of our breakout systems.
We shifted it 20 bars back.
Suddenly, the signals were cleaner.
The performance was stable.
And DMI finally made sense.
Here’s the full structure:
DMI shifted back 20 bars
✅ Threshold = 35
✅ Long and short logic treated independently
✅ Entry allowed only between 8:00–15:00
✅ Trigger: breakout from open with 3× volatility filter
✅ Exit after 100 bars or by Friday close
No optimization needed.
And it still performed across ES and Nasdaq.
Watch the full video + get the free resource in the comments.

Breakout Trading Academy retweeted
The harsh reality:
The market preys on your weaknesses.
If you’re trading to feel alive or escape your struggles, you’re already losing.
Trading sometimes feels like an uphill battle and this could give you the clarity you need.
I recently sat down with Jason from “Against All Odds Research” to unpack the real reason so many traders struggle.
Watch the full discussion here 👇 youtube.com/live/-cLzKi-ShDs

Breakout Trading Academy retweeted
I can find a trading edge on any market in about 60 seconds.
No indicators required.
The method is called market mapping.
Here’s exactly how it works:
> Load 15 years of 60-minute data
> Map every entry hour × exit hour × day of the week
> Color the grid by net profit
> Filter for average trade size and profit/drawdown ratio
> Check the robustness index (does the edge survive shifting entry/exit by 1–3 hours?)
> Confirm it still holds in the last 1–3 years
That’s the whole process.
On E-mini NASDAQ this immediately surfaces strong structural tendencies, especially Mondays and certain overnight holds.
Clean example:
Enter 6am -> Exit 4pm (or longer) every Monday.
The edge survives time shifts and remains valid recently.
These aren’t indicator curves.
They are the market’s own built-in time tendencies.
Once you have the time window, you can trade it standalone or drop a breakout strategy inside it.
Full walkthrough:
breakoutos.com/blog/market-m…

I ran 16.5 million filter tests on NASDAQ.
One condition beat every other oscillator, trend indicator, volatility filter, and volume condition.
The winner: a simple CCI correction filter.
Exact rule for long entries:
Lowest(CCI(27), 18 bars) < –100
In plain English:
Only take the long breakout if, somewhere in the last 18 bars, CCI(27) dipped below –100.
(i.e. the market has already had a real correction)
Results across 1,000 strategy variations:
> Net profit improved on 69% of strategies
> Average trade improved by 22% on more than half
> Bounce index: 57.8% (turned that many losing variations profitable)
On the base NASDAQ breakout:
> Profit/drawdown ratio: 7.53 → 8.6
> Average trade: $116 → $149
Breakouts taken after a genuine washout have room to run.
Breakouts taken into already-extended strength tend to fade.
This wasn’t tested on one strategy.
It was stress-tested across 1,000 different ones.

If you want more filter approaches like this one, the Indicators Playbook covers the indicators and conditions that actually improved results across large-scale tests, with real settings and code.
go-bta.com/indicators-playbo…

Breakout Trading Academy retweeted
They told us to avoid low ADX.
Turns out... that's exactly where the real edge hides.
📉 SHORTS → ADX > 30 = confirmation
📈 LONGS → low ADX = real edge
Low ADX signals coiled volatility.
It’s not chop. It's a buildup.
So we built our model breakout strategy using:
• Volatility = open–low difference
• Breakout level = low + (3.3 × volatility)
• Stop entries only
• Entry filter: 8am–3pm
• Exit: when ADX > 40 or after time limit
This flip gave us a consistent edge in markets most traders avoid.
Full breakdown + free resource in the comments

Breakout Trading Academy retweeted
I ran 16.5 million filter tests on NASDAQ.
One condition beat every other oscillator, trend indicator, volatility filter, and volume condition.
The winner: a simple CCI correction filter.
Exact rule for long entries:
Lowest(CCI(27), 18 bars) < –100
In plain English:
Only take the long breakout if, somewhere in the last 18 bars, CCI(27) dipped below –100.
(i.e. the market has already had a real correction)
Results across 1,000 strategy variations:
> Net profit improved on 69% of strategies
> Average trade improved by 22% on more than half
> Bounce index: 57.8% (turned that many losing variations profitable)
On the base NASDAQ breakout:
> Profit/drawdown ratio: 7.53 → 8.6
> Average trade: $116 → $149
Breakouts taken after a genuine washout have room to run.
Breakouts taken into already-extended strength tend to fade.
This wasn’t tested on one strategy.
It was stress-tested across 1,000 different ones.
Exact condition and full results:
breakoutos.com/blog/nasdaq-1…

Breakout Trading Academy retweeted
“Why have my trading strategies suddenly stopped working?”
It’s not just you.
More traders than ever - from beginners to seasoned pros - are scratching their heads, wondering the same thing. And even the giants are stumbling.
Take Man Group:
➡️One of the world’s biggest hedge funds
➡️Their stock is down nearly 30% in the past 12 months
➡️Analysts are pointing fingers at underperforming computer-driven (quant) strategies
So, if firms with billions in research and supercomputers can’t adapt, it’s no surprise individual traders are struggling too.
The truth?
🛑Much of the old trading game is over
🛑AI isn’t just “helping” the markets - it’s reshaping them
🛑Traders who don’t adapt to this new AI Era will stay stuck, confused, and left behind
That’s exactly what I cover in my new video series “The AI Shockwave Hitting Traders Right Now…”
Once you see what’s really happening, you’ll understand how to trade smarter, while others are still clinging to outdated playbooks.
Sign up for the free video series today, link in the comments.

Breakout Trading Academy retweeted
I tested 1,725 advanced moving average breakout strategies on E-mini Nasdaq (60-minute).
Not regular moving averages. Midpoint and median averages that measure price equilibrium.
The setup:
- Point of initiation: advanced midpoint or median
- Space: ATR (5, 20, or 40) multiplied by a fraction
- Exit: end of day
- 23 different points of initiation × 3 ATR periods × 25 fractions = 1,725 tests
Midpoint period 15 came out on top. It worked across the vast majority of the tested samples and produced better out-of-sample scores than in-sample.
One detailed example: MidPoint(15) + 0.4 × ATR(5) Robustness suite score: 81 (in-sample 68, out-of-sample 86)
Advanced averages worked very well as a foundational breakout model, at least on this market and timeframe.

Breakout Trading Academy retweeted
I’ve built over 2,500 trading strategies at my hedge fund and only one has earned the title “risk-free.”
Not because it’s magic.
Not because it’s perfect.
But because it’s built on a logic filter with zero optimizations.
No adjustable inputs.
No overfitting risk.
Just pure breakout trading, stripped to the bone.
It works across ES, YM, S&P 400, without tweaking a single thing.
Here’s the result. 👇
