

Frontier tech, longevity, investing, and the future of being human. I write about it two ways: nonfiction (One-Person Empire) and sci-fi (Age of Unbounding).
USA and Rio de Janeiro
Joined April 2009
- Tweets15.8K
- Following720
- Followers852
- Likes2K




Pinned Tweet
In June, investors at US brokerages owed $1.06 trillion more than the cash in their accounts.
The lowest reading in the history of the data.
I wrote a book on what leverage like this has meant before, and made a dated call.
Free until Dec 31. Link below.

In 2002, Sun Microsystems CEO Scott McNealy looked back at the peak of the dot-com bubble and asked investors one question:
“At 10x revenues… what were you thinking?”
He explained that even at 10x sales you would need zero costs, zero expenses, zero taxes, zero R&D, and 100% of revenue paid out as dividends for 10 years just to break even.
Sun later fell more than 90%.
Palantir $PLTR is currently trading at roughly 50–60x trailing sales.
That is 5–6 times the multiple McNealy already called ridiculous.
At these prices the same logic requires something closer to 55 years of paying out every dollar of current revenue as pure dividends — still assuming zero costs, zero taxes, and flat growth forever.
What are we thinking?

Buying Palantir at these prices is like paying $150 for a slice of pizza that currently costs $1 to produce.
Here’s the math.
Palantir’s market cap is roughly $429 billion.
Last twelve months profit: about $3.7 billion.
That’s a trailing P/E of ~125x.
In pizza terms:
You buy the entire shop.
The shop currently makes $3.7 billion in profit a year.
You paid $429 billion for it.
If profits stayed flat forever, it would take you 125 years of collecting every dollar of profit just to get your money back.
Even on next year’s expected earnings (forward P/E ~80x), you’re still looking at roughly 80 years of all future profits to break even — assuming zero growth after that.
For the price to make sense, the shop has to keep growing extremely fast for a long time. High multiples only work if the growth is both large and durable. Any slowdown in the growth rate and you are left holding a very expensive piece of pizza.
The quality of the growth also matters. Recent results still show receivables rising faster than sequential revenue. Strong headline growth, but part of the “sales” is still unpaid.
Not advice.
Do your own work.
Make your own Pizza.

Apple just guided to 7–10% growth and 45–46% gross margins.
That profile historically supports a mid-20s to low-30s forward P/E.
The stock is still trading at 35–38x.
At those multiples the math points to roughly $270–$320.
The arithmetic doesn’t require a crash — just a recognition that mid-teens growth is over and the multiple has room to compress if the guide holds.
Not a sell call. Just math. $AAPL

Palantir’s Q3 numbers look strong on the surface.
Revenue +96% to $2.31B.
U.S. commercial surpassed government for the first time.
Guidance raised again.
But the quality flag is still there.
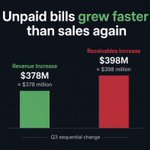
Accounts receivable rose ~$398M in the quarter.
Revenue rose ~$378M.
Unpaid bills grew faster than the new sales again.
Cash generation remains excellent, but the collection lag continues.
At this valuation, that gap matters more than the headline beat.

Apple $AAPL reports today. The setup looks stretched.
• Trading at ~39x trailing / ~36x forward earnings with revenue growth expected to slow into the mid-to-high single digits.
• No clear AI-driven iPhone upgrade supercycle. Replacement cycles are lengthening and early iPhone 18 Pro signals in China have been soft (shorter lead times, discounts). • Still heavily exposed to China for both demand and manufacturing. Local competitors keep taking share. • Services is the high-margin engine, but it still depends on hardware units and faces regulatory risk (Google TAC payments, App Store rules).
• Market is treating a mature hardware + ecosystem company like a high-growth AI platform. That gap is the short.
Earnings can always surprise. The multiple leaves little room for disappointment.
Not advice.

Palantir $PLTR is booking more sales.
A growing share of those sales is still unpaid.
In 9 of the last 12 quarters, the unpaid bills grew faster than the actual sales.
One customer alone is a big piece of the unpaid pile.
This doesn’t mean the sales aren’t real.
It does mean the cash is arriving slower than the growth numbers suggest.
Probably nothing to worry about … 👝

Michael Burry’s point on $PLTR:
At a fully diluted market cap north of $350B, you could buy Northrop Grumman, General Dynamics, and Lockheed Martin—and still have enough left over for L3Harris.
Today the gap is even wider. PLTR sits around $470B. The four traditional defense primes combined are still smaller.
But the earnings gap is the opposite story.
In 2025 those four companies generated ~$15B in combined net income.
PLTR generated $1.6B.
On a trailing basis the four still produce roughly 5–6× more net earnings.
These are companies with decades of Pentagon contracts, massive backlogs, hard assets, and actual manufacturing. PLTR is priced as if its software platform has already replaced them.
Burry has held long-dated puts on the name for a long time. The comparison is still the cleanest version of his valuation argument.

$MU cash vs market cap near a cycle top.
Market cap: ~$1.06T
Cash + short-term investments: ~$43B
Broader cash + marketable securities: ~$73B
That’s roughly 4–7% of the equity value sitting in cash.
The rest is priced on peak-cycle earnings from the AI memory boom. Memory has never stayed this profitable forever. SK hynix leads HBM, Samsung is ramping HBM4 hard, and capacity is coming from all three plus Chinese players in conventional DRAM.
When the cycle turns, cash doesn’t cushion a $1T valuation the way people think it does. Peak earnings get capitalized at trough multiples.
The cash pile is real. The permanence of the margins is not.
Palantir $PLTR (~$475B market cap) holds only ~$9.4B in cash.
That’s ~2% of the valuation.
The rest is a pure bet on growth that must stay exceptional.
Claude (and other frontier models) is the under-discussed risk.
What used to require a specialized platform + ontology + forward-deployed engineers can now be approximated by connecting Claude to a company’s own data + some lightweight agents.
The barrier for “good enough” operational AI just collapsed.
Palantir’s real moat isn’t the model. It’s deep data integration, security clearances, and high switching costs once you’re embedded. That still matters for defense and complex enterprises. But for a growing set of commercial use cases, the premium is harder to defend.
Meanwhile, pairing a Grok bot (persistent memory, routines, computer access) with Claude creates something closer to a private operating system for one person or a small team. One handles long-horizon execution and tools; the other brings strong reasoning and coding. Together they let you build, analyze, and operate systems that used to require a vendor.
The technology is evolving faster than most enterprise software premiums. Cash doesn’t protect a 160× earnings multiple when the product layer is getting cheaper to replicate.

Peter Agro retweeted

In this AI valuation reset driven by high capex, debt and delayed ROI, the strongest short candidates are overleveraged neoclouds: CRWV, NBIS, IREN and APLD. Bond yields spiking above 15% and refinancing pressure leave them most exposed to further downside versus better-capitalised leaders.
You call it a "Danish."
The Danes call it "Viennese bread."
And the Germans call it a "Copenhagen."
How a 1850s labor strike transformed a butter crisis into the world's most confused pastry.
🧵👇🏼

The S&P 500 is near record highs.
Meanwhile 59% of its stocks are already in their own bear markets (down 20%+ from their individual peaks). 84% are at least 10% below their highs. The median stock is more than 20% off its high.
This is the classic “index looks fine, average stock doesn’t” setup.
Historically it is rare and usually a warning, not confirmation:
• Similar narrow leadership near highs showed up in Sept 1972 (before the 1973–74 bear) and March 2000 (start of the dot-com unwind).
• At the Oct 2007 peak, ~42% of stocks were already 20%+ off their highs.
• Weak breadth while the index is still near its high has tended to produce weaker subsequent 12-month returns than ordinary near-record periods. Weak breadth during a clear selloff has more often preceded bounces.
Not every episode ends badly. May 2023 had the same narrow look and the AI leaders kept carrying the index higher.
Concentration can last longer than expected when the few names driving returns keep delivering.
The practical question now is simple: do the remaining leaders broaden participation, or do they eventually follow the rest of the market lower? A lot of the damage has already happened stock by stock. The index just hasn’t reflected it yet.
Peter Agro retweeted
FINRA update: margin debt for September was $1.480 trillion.
The June record of $1.502 trillion still stands — but
the gap has closed three months running: $85B, $48B,
$22B.
Net free credit: −$1.046 trillion.
The signposts are in Chapter Twelve of Last Call.
Free until Dec 31: lastcall.peteragro.com
