

Double exposure, single trade ETFs. Leveraged for the Long Run. https://xitter.gq/t.co/qkOUUiiImp
Brooklyn, NY
Joined June 2023
- Tweets419
- Following794
- Followers1.9K
- Likes226
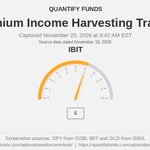
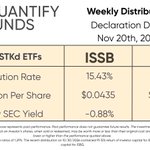



Here is the SPY, IBIT, and GLD volatility harvesting update for $ISSB (IncomeSTKd 1x US Stocks & 1X Bitcoin Premium ETF) and $ISBG (IncomeSTKd 1x Bitcoin & 1X Gold Premium ETF).
We are harvesting very little volatility on SPY in ISSB, with a score of 1 / 10, down from 10 / 10. Meanwhile, we are harvesting a moderate amount of volatility on IBIT in ISBG, with a score of 6 / 10, up from 5 / 10. ISSB’s IBIT harvesting score is also 6 / 10, up from 5 / 10. We are harvesting a modest amount of volatility on GLD in ISBG, with a score of 3 / 10, down from 4 / 10.
The graphic shows SPY from ISSB and IBIT and GLD from ISBG. The IBIT dial represents ISBG only.
Scores are as of the close on 11/19/26. All comparisons are with the close on 11/18/26.
Scores are snapshots, not investment returns, yields, forecasts, or guarantees of income. A higher score does not by itself indicate better performance or lower risk.
Theta of the US equity options, theta of the Bitcoin options, and theta of the Gold options drive the volatility harvesting score of 1–10. Theta values correspond to the following scores: 1 (theta ≤ 0), 2 (0.01 ≤ theta < 0.03), 3 (0.04 ≤ theta < 0.06), 4 (0.07 ≤ theta < 0.10), 5 (0.11 ≤ theta < 0.13), 6 (0.14 ≤ theta < 0.16), 7 (0.17 ≤ theta < 0.19), 8 (0.20 ≤ theta < 0.23), 9 (0.24 ≤ theta < 0.27), 10 (0.28 ≤ theta). Theta, the Greek letter θ, is an options risk factor that measures the speed of decline in the value of an option as it approaches its expiration date.
Investing involves risk, including possible loss of principal. Options and leverage involve additional risks and may magnify losses; option-writing strategies may limit upside participation. Income and distributions are not guaranteed.
Before investing, carefully consider each Fund’s investment objectives, risks, charges, and expenses, and read its prospectus carefully. View fund holdings, prospectuses, and disclosures at quantifyfunds.com.

ISBG trade update: Needed to increase positive carry in IBIT so sold 11/30/2026 37 strike IBIT calls.
ISSB trade update: Needed to roll exposure in SPY to keep tenor aligned with target positioning so rolled 11/20/2026 730 strike SPY calls into 11/30/2026 750 strike SPY calls. Needed to increase positive carry in IBIT so sold 11/30/2026 37 strike IBIT calls.
View fund holdings and disclosures quantifyfunds.com.

For ISSB standardized performance, visit quantifyfunds.com/optionsbas…….
For ISSB prospectus, visit docs.quantifyfunds.com/J9uMn….
For ISBG standardized performance, visit quantifyfunds.com/optionsbas…….
For ISBG prospectus, visit docs.quantifyfunds.com/J9uMn….
*The Distribution Rate is the annual rate an investor would receive if the most recently declared distribution, which includes option income, remained the same going forward. The Distribution Rate is calculated by annualizing the Fund’s most recent distribution and dividing the resulting amount by the Fund’s most recent NAV. The Distribution Rate represents a single distribution from the ETF and does not represent its total return. Distributions are not guaranteed.
**The 30-Day SEC Yield represents net investment income, which excludes option income, earned by the Fund over the 30-Day period ended at the most recent month-end, expressed as an annual percentage rate based on the Fund’s share price at the end of the 30-Day period.
Introducing $IQQI, the IncomeQ Nasdaq-100® Premium Income ETF, launched on Wednesday. The team plans to share daily trades and explain how the portfolio evolves in pursuit of outperformance.
Learn more about $IQQI here
hubs.li/Q04FTB220


IQQI: uncapped Nasdaq-100® upside exposure plus income from selling rich put premium.
Before investing, carefully consider each Fund’s investment objectives, risks, charges, and expenses, and read its prospectus carefully. View fund holdings, prospectuses, and disclosures at
quantifyfunds.com/iqqi
Only 1 day till $IQQI, the IncomeQ Nasdaq-100® Premium Income ETF starts trading!

ISSB trade update: Needed to add exposure to IBIT so bought 12/18/2026 43 strike IBIT calls and sold 12/18/2026 40 strike IBIT puts.
View fund holdings and disclosures quantifyfunds.com.
Selling Hedges to the 1%. Introducing IQQI, the IncomeQ Nasdaq-100® Premium Income ETF
Before investing, carefully consider each Fund’s investment objectives, risks, charges, and expenses, and read its prospectus carefully. View fund holdings, prospectuses, and disclosures at quantifyfunds.com/iqqi
In pursuit of Outperformance. Introducing $IQQI, the IncomeQ Nasdaq-100® Premium Income ETF


Only 4 days till $IQQI, the IncomeQ Nasdaq-100® Premium Income ETF starts trading!

ISBG trade update: Premium in GLD became de minimis so removed 11/20/2026 360 strike GLD calls. Needed to reduce exposure to GLD so rolled 12/18/2026 370 strike GLD puts into 03/19/2027 350 strike GLD puts. Needed to reduce exposure to IBIT so rolled 11/20/2026 43 strike IBIT puts into 12/18/2026 40 strike IBIT puts.
ISSB trade update: Needed to reduce exposure to IBIT so rolled 11/20/2026 43 strike IBIT puts into 12/18/2026 40 strike IBIT puts.
View fund holdings and disclosures quantifyfunds.com

For ISSB standardized performance, visit quantifyfunds.com/optionsbas…….
For ISSB prospectus, visit docs.quantifyfunds.com/J9uMn….
For ISBG standardized performance, visit quantifyfunds.com/optionsbas…….
For ISBG prospectus, visit docs.quantifyfunds.com/J9uMn….
*The Distribution Rate is the annual rate an investor would receive if the most recently declared distribution, which includes option income, remained the same going forward. The Distribution Rate is calculated by annualizing the Fund’s most recent distribution and dividing the resulting amount by the Fund’s most recent NAV. The Distribution Rate represents a single distribution from the ETF and does not represent its total return. Distributions are not guaranteed.
**The 30-Day SEC Yield represents net investment income, which excludes option income, earned by the Fund over the 30-Day period ended at the most recent month-end, expressed as an annual percentage rate based on the Fund’s share price at the end of the 30-Day period.
2
205
Here is the SPY, IBIT, and GLD volatility harvesting update for $ISSB (IncomeSTKd 1x US Stocks & 1X Bitcoin Premium ETF) and $ISBG (IncomeSTKd 1x Bitcoin & 1X Gold Premium ETF).
We are harvesting very little volatility on SPY in ISSB, with a score of 1 / 10, unchanged from 1 / 10. Meanwhile, we are harvesting very little volatility on IBIT in ISBG, with a score of 1 / 10, unchanged from 1 / 10. ISSB’s IBIT harvesting score is also 1 / 10, unchanged from 1 / 10. We are harvesting very little volatility on GLD in ISBG, with a score of 2 / 10, unchanged from 2 / 10.[quantifyfunds +1]
The graphic shows SPY from ISSB and IBIT and GLD from ISBG. The IBIT dial represents ISBG only.
Scores are as of the close on 11/11/26. All comparisons are with the close on 11/10/26.
Scores are snapshots, not investment returns, yields, forecasts, or guarantees of income. A higher score does not by itself indicate better performance or lower risk.
Theta of the US equity options, theta of the Bitcoin options, and theta of the Gold options drive the volatility harvesting score of 1–10. Theta values correspond to the following scores: 1 (theta ≤ 0), 2 (0.01 ≤ theta < 0.03), 3 (0.04 ≤ theta < 0.06), 4 (0.07 ≤ theta < 0.10), 5 (0.11 ≤ theta < 0.13), 6 (0.14 ≤ theta < 0.16), 7 (0.17 ≤ theta < 0.19), 8 (0.20 ≤ theta < 0.23), 9 (0.24 ≤ theta < 0.27), 10 (0.28 ≤ theta). Theta, the Greek letter θ, is an options risk factor that measures the speed of decline in the value of an option as it approaches its expiration date.
Investing involves risk, including possible loss of principal. Options and leverage involve additional risks and may magnify losses; option-writing strategies may limit upside participation. Income and distributions are not guaranteed.
Before investing, carefully consider each Fund’s investment objectives, risks, charges, and expenses, and read its prospectus carefully. View fund holdings, prospectuses, and disclosures at quantifyfunds.com.

ISSB trade update: Needed to reduce exposure to SPY so sold 12/31/2026 770 strike SPY calls and bought 11/20/2026 750 strike SPY puts.
View fund holdings and disclosures quantifyfunds.com.
Here is the SPY, IBIT, and GLD volatility harvesting update for $ISSB (IncomeSTKd 1x US Stocks & 1X Bitcoin Premium ETF) and $ISBG (IncomeSTKd 1x Bitcoin & 1X Gold Premium ETF).
We are harvesting very little volatility on SPY in ISSB, with a score of 1 / 10, down from 5 / 10. Meanwhile, we are harvesting very little volatility on IBIT in ISBG, with a score of 1 / 10, unchanged from 1 / 10. ISSB’s IBIT harvesting score is also 1 / 10, unchanged from 1 / 10. We are harvesting very little volatility on GLD in ISBG, with a score of 2 / 10, unchanged from 2 / 10.
The graphic shows SPY from ISSB and IBIT and GLD from ISBG. The IBIT dial represents ISBG only.
Scores are as of the close on 11/10/26. All comparisons are with the close on 11/09/26.
Scores are snapshots, not investment returns, yields, forecasts, or guarantees of income. A higher score does not by itself indicate better performance or lower risk.
Theta of the US equity options, theta of the Bitcoin options, and theta of the Gold options drive the volatility harvesting score of 1–10. Theta values correspond to the following scores: 1 (theta ≤ 0), 2 (0.01 ≤ theta < 0.03), 3 (0.04 ≤ theta < 0.06), 4 (0.07 ≤ theta < 0.10), 5 (0.11 ≤ theta < 0.13), 6 (0.14 ≤ theta < 0.16), 7 (0.17 ≤ theta < 0.19), 8 (0.20 ≤ theta < 0.23), 9 (0.24 ≤ theta < 0.27), 10 (0.28 ≤ theta). Theta, the Greek letter θ, is an options risk factor that measures the speed of decline in the value of an option as it approaches its expiration date.
Investing involves risk, including possible loss of principal. Options and leverage involve additional risks and may magnify losses; option-writing strategies may limit upside participation. Income and distributions are not guaranteed.
Before investing, carefully consider each Fund’s investment objectives, risks, charges, and expenses, and read its prospectus carefully. View fund holdings, prospectuses, and disclosures at quantifyfunds.com.
