

That which seems to be wealth may in verity be only the gilded index of far-reaching ruin. Draw your own conclusions.
Joined December 2013
- Tweets36.2K
- Following50
- Followers6.5K
- Likes1.1K
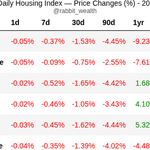

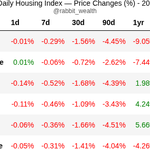


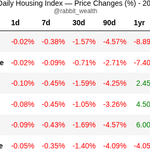

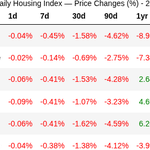
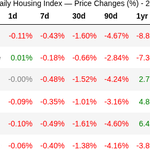

📉 2026-10-29: A year ago Perth was running at +33.8%/yr. Today: -19.5%/yr, a 53-point swing, the biggest on the board. Brisbane follows at 42 points (+22.0% to -19.8%). Melbourne swung least, 17.5 points, from +8.5% to -9.0%.


📉 2026-10-28: The best-to-worst 30d gap tops 1pp: Melbourne -0.70% vs Brisbane -1.71%. Annualised that's 12.1pp, up from 8.2pp a month ago. Melbourne's slide eases (+1.9pp), Brisbane's deepens (-2.7pp). Divergence builds.


📉 2026-10-27: Adelaide's week did the most damage, -23.9%/yr over 7 days vs -13.1% across 30. Brisbane too, -27.2% vs -20.1%. Melbourne flipped: a quiet -3.0% week in a -8.6% month. Sydney's week also ran gentler, -14.9% vs -18.7%.


"Outstanding opportunity for first-time buyers, downsizers, or savvy investors."
Best for the agency: sold it, leased it, sold it again all in 16 months.
For the investor: -$68.5k nominal, over $100k all-in after stamp duty and agent fees.
Jun 2025: $955k → Oct 2026: $886.5k

📉 2026-10-26: Calendar 2026 so far: Sydney -9.4%, Melbourne -7.7%, Brisbane -1.3%. Perth clings to +0.05% YTD after October's -1.4%, the steepest month of any capital. Adelaide alone holds a real gain, +0.9%.


📉 2026-10-25: Adelaide, last capital to peak (136d ago), sits just -4.0% off its top, and its slide has stopped deepening: +0.5pp vs -5.1pp a month ago. Brisbane's cushion above its 365d low thins to 2.4%, decline deepening (-2.1pp).


Oh là là. Effortless living meets a $3m loss in 3 years on Olola Ave.
Sep 2023: $9.5m → Oct 2026: $7.07m
-$2.43m nominal, over $3m all-in after stamp duty and agent fees.

📉 2026-10-24: Sydney has closed lower 45 days straight, 17 shy of its 62-day mark for the year. Perth is 37 deep, Brisbane 23, six from its record. The composite's 151-day run is now the longest in the 365d window.


📉 2026-10-23: A $1M Perth home bought at the May peak is worth $927k today, 162 days on, down $73k. Undoing that 7.3% fall takes +7.9%. A buyer at Sydney's March top is out $97k and needs +10.8% to get back.


📉 2026-10-22: Every capital's past week fell faster than its month. Brisbane diverges most, at -26.4%/yr over 7 days vs -18.5% across 30. Perth follows at -23.1% vs -18.7%. Sydney alone tracks its run rate, -19.1% vs -18.6%.


Bought into a "sought-after pocket" of Melrose Park. Left with a hole in their own.
Nov 2023: $2.94m → Oct 2026: $2.6m
-$340k nominal, over $500k all-in after stamp duty and agent fees.
Gone in under three years.

📉 2026-10-21: Best-to-worst 30d spread is now 0.90pp, Melbourne -0.77% vs Perth -1.67%. Annualised that's 10.8pp, up from 9.1pp a month ago. Melbourne's decline is easing (+2.3pp) while Perth's deepens (-1.5pp). The gap is opening.


📉 2026-10-20: Sydney and Melbourne sit right on their 365d lows. Sydney is 215d past peak and -9.6% below it, Melbourne 317d and -7.9%. Perth still holds a 6.9% cushion above its floor, Adelaide 5.1%, Brisbane just 3.1%.


Someone took away the punchbowl in Punchbowl.
Mar 2026: $1.432m → Oct 2026: $1.2m
-$232k nominal, over $300k all-in after stamp duty and agent fees. Gone in 7 months.
Arrived at the height of the party, left with the hangover.

📉 2026-10-19: Current 30d pace, annualised: Perth -20.3%/yr and Sydney -18.9% hold the bottom, Brisbane -17.6% just above. Adelaide sits at -12.0%, Melbourne the shallowest at -9.5%. Every capital in the red, none under single digits bar Melbourne.


Vendor needed to buy in 8 days, then needed to sell in 7 months.
Mar 2026: $1.505m → Oct 2026: $1.325m
-$180k nominal, over $250k all-in after stamp duty and agent fees.
-12%: deeper than Sydney's entire 9.5% drawdown.

📉 2026-10-18: Brisbane is 17 days red, past the halfway mark to its 29-day record — the tightest leash on the board belongs to it, not Sydney (39) or Perth (31). Melbourne and Adelaide have only 3 each, yet Melbourne's decline is the one easing (+2.7pp).


Possibilities: endless. Patience: four months.
Jun 2026: $2.06m → Oct 2026: $1.95m
-$110k nominal, over $200k all-in after stamp duty and agent fees.
Same agency clipped the ticket both ways.

📉 2026-10-17: Perth's annual print still reads +7.4%, but the last 30 days annualise to -19.5%/yr — a 27pp gap, the widest on the board. Adelaide tells the same story: +5.5% on the year, -14.4%/yr now. Those headline gains are pure rear-view.


