

data storyteller / data scientist / entrepreneur / photographer / sociologist
Brussels Belgium
Joined February 2012
- Tweets430
- Following603
- Followers297
- Likes2.2K



Are you pursuing a PhD in data visualization, or know someone who is?
Join us for the Data Visualization Society's PhD Mixer on
Tuesday, October 29th!
This is the first event, and we hope to make it a regular opportunity to connect and share.
Please help us spread the word!

1
1
93
For more details, here is the link Thanks in advance for your support!
eventbrite.com/e/dataviz-phd…
35
Ralitza Soultanova retweeted

Pour @lecho, je reviens sur la trajectoire électorale au long cours des partis.
Schématiquement, jusqu’en 1965, la dynamique électorale est assez stable avec deux familles dominantes, les sociaux chrétiens et les socialistes, premiers parti en...
1/5
lecho.be/economie-politique/…
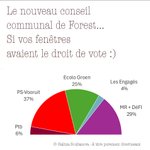
🌍 Voici le vote pour les élections communales de demain... si c'était vos fenêtres qui votaient ! 🗳️
Aujourd'hui, je me suis baladée dans Forest. J’ai marché 20 km et compté 310 affiches sur vos fenêtres. 🚶♂️🪟

2
5
583
🔇 Le PTB, très actif sur les réseaux sociaux, est absent des fenêtres.
🏘️ L'affiche attire l'affiche : certaines rues sont totalement dépourvues, tandis que d'autres comptent des affiches sur plus de la moitié des maisons.
Bien sûr, tout cela est pour s'amuser. 😄
1
1
60
Demain, c’est votre vote qui compte. 🗳️N'oubliez pas d'aller voter !
#Elections2024 #Forest #Vote #Democrati
60
Ralitza Soultanova retweeted

Today we’re launching a bold new vision: an open-source static site generator — Observable Framework — for creating fast, beautiful data apps you can host anywhere. Use JavaScript for interactive graphics with Python, R, or any language for data analysis. observablehq.com

Crushed my 2023 step goal with an avg of 15K steps/day, totaling 5.5M for the year! 🏃♂️ Key achievements: 100 km Vitosha, 20 km of Brussels, and 33 km Bellasitza Sky Run. Each event forged greater endurance.
2024's target? A marathon. 🎯
#TidyTuesday week 1.
#dataviz #Rstats

📊 After sharing the data for Wallonia, let's have a look at Flanders.
🍝 Spaghetti charts are difficult to read but in this case I think it perfectly illustrates the tight competition.
🔗 For an interactive version lnkd.in/eDHXenJb
#ElectionData #Flanders #VotingTrends

Après avoir examiné la situation en Wallonie hier, avec @ralitza_s, je vous propose un petit bilan des intentions de vote en Flandre depuis le scrutin de mai 2019. Le point de départ est le score de 2019.
Rapidement après le scrutin, une dynamique majeure s’est imposée: la...
1⃣

2
310
Pour commencer l'année une visualisations des intentions de vote en Wallonie depuis les dernières elections de 2019. Avec @PDelwit
Heureuse année à toutes et tous.🍾
À l’aube de cette année électorale, avec @ralitza_s, je vous propose un petit bilan des intentions de vote en Wallonie depuis le scrutin de mai 2019: le point de départ est le score de 2019.
Sans mouvements homogènes et spectaculaires,...
1⃣

1
196
Interested by how to do this data viz in R ?
Find the code and explanations on Medium
shorturl.at/anU39

3
142
Celebrating International Migrants Day - December 18 🌍
Most people around the world reside in their country of origin. Only about 3.6% of the global population, approximately 280 million people, live outside their home country.
#InternationalMigrantsDay #MigrationFacts #dataviz

2
5
188
Casual Saturday exploring ChatGPT' image generation 🧐 When generating images of professionals there is a gender pattern. 🚹= Data Expert or plumber, 🚺= Nurse or teacher. Only specific requests broke the mold.
Reinforcing the bias #data #AIbias #genderbias

4
132
Sometimes, less really is more. 🌟 I think this graph perfectly captures this - clear, concise, and visually stunning.
📊💡 Check out this and other amazing entries from the Little Pictures of Climate competition! #DataViz #LittlePicturesCompetition
climate.esa.int/en/little-pi…

4
108
Belgian TV just aired a CO2 data visualization segment. It's a prime example of what to avoid: no title, an overload of segments, and missing scales. A clear case of how not to communicate data. #DataDisaster #VisualizationFail #RTL

1
76

Great data story example -
Spain lives in flats: why we have built our cities vertically especiales.eldiario.es/spain…
1
87