

With great amount of data comes great data processing. MS Stat student | UPD 🇵🇭 | Aspiring educator and climate data scientist 🌏🌧️☀️
Philippines
Joined November 2014
- Tweets5.4K
- Following410
- Followers298
- Likes5.5K









Siegfred Codia retweeted

An all-in-one platform that brings together weather forecasts and satellite observations to generate color-coded, impact-based assessments of potential community impacts from flooding, landslides, and storm surges.
#nextgeneration
#gawangpinoy

What's the point of the transport strike if companies and schools shift to WFH and online classes?
56
Kasi if bumukod ako, yung parents ko yung kawawa ahaha sksksks

BAKIT MARAMING 30-YEAR-OLD FILIPINOS ANG NAKATIRA PA RIN SA BAHAY NG MAGULANG?
It's not just culture. It's economics. Inflation hits 1.7%, unemployment reaches 5%, and over half of families consider themselves poor.
READ: tinyurl.com/4fserup8

71


Siegfred Codia retweeted

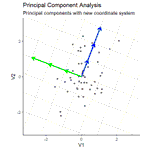
When I teach Principal Component Analysis (PCA), I start with the core idea: a linear, orthogonal transformation that maximizes variance and removes correlation.
Then we jump into my interactive, hands-on demo — using a #Python dashboard built with @matplotlib to perform PCA step by step! 📊🧠
Check it out here:
🔗 github.com/GeostatsGuy/DataS…

Kung di man siya maka-attend sa Finale dahil manganganak na siya, at least we can still say that...
She delivered 💅✨

121

Umaasa pa rin ako na maglo-load yung UVLe tonight kasi may iuupload ako na materials adnfjisbpdgijlsfg
1
1
125

Siegfred Codia retweeted

Simpson’s Paradox is a fascinating statistical phenomenon where the relationship between two variables can completely change when a third variable is considered. This often leads to contradictory conclusions if not carefully analyzed.
For example, in a data set, you might see a negative trend between variables X and Y. However, when you split the data into subgroups based on a third variable, Z, the trend might reverse or disappear.
Key takeaways:
✔️ Always consider potential lurking variables that could influence your results.
✔️ Be cautious with aggregated data; sometimes the real insights lie in the subgroups.
✔️ Use visualizations to better understand the relationships within your data.
The Wikipedia article on Simpson's Paradox offers this great visualization (en.wikipedia.org/wiki/Simpso…), emphasizing the importance of thorough analysis to avoid such pitfalls. This paradox underscores the necessity for data analysts to be meticulous in their work to prevent erroneous interpretations.
For regular tips on data science, statistics, Python, and R programming, check out my free email newsletter! More info: eepurl.com/gH6myT
#Data #RStats #coding