
Technical analysis, Elliott Wave Theory, cycle theory. Love the charts. No financial advice. If you don't understand the chart, don't try to trade it.
Joined February 2013
- Tweets793
- Following60
- Followers266
- Likes147


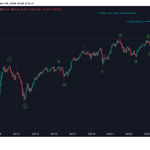


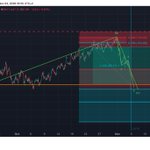
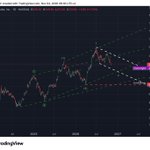


#CVX first bearish weekly close since the weekly cycle low (1W DSS bearish cross, 1W close below 10W SMA). However, it's a daily cycle low window with the 1D DSS pretty low. Bear traps are common at this time. The next move up is the time to pay attention since the buy at 168.


Ilya Slutskin retweeted

The Most Important Realization for a Technical Trader is this
If you get this one truth, your entire trading career changes overnight: Technical analysis doesn’t predict the market, it frames your behavior within it.
Most traders spend years trying to use charts to forecast the future. They draw levels, patterns, fibs, and divergences thinking they’ll “know” what comes next.
But the market isn’t a puzzle to be solved, it’s a dynamic auction that constantly reprices information.
The true power of technical analysis is not prediction, it’s context. It helps you define:
Where your thesis is valid or invalid.
Where risk and opportunity are asymmetrical.
Where others are trapped and where you can act objectively.
Once you realize this, your charts stop being prophecy tools and become decision frameworks.
Your trades stop being about being right and start being about executing your edge
The shift looks like this:
From “What will happen?” → to “What will I do if it happens?”
From “I think price will go up.” → to “If this level reclaims, I’ll look for confirmation and risk 1R.”
From prediction → to probability.
The moment a trader stops using charts to predict and starts using them to prepare, is the moment they cross from amateur to professional.
#BAC 1M - if this is really a multi 1-2, the wave 3 might be around the corner after the flat finishes pretty soon.

#VST 1M - that wave 4 held the mnPOC and 0.236 fib. Need to track lower time frames for a good entry.

#NBIS 1hr - taking out 231.72 killed the short term bearish counts but pretty much confirmed 5 waves down


#NBIS 4hr - now at high time frame support. Would like to see a decent wave 4 and 5 for the wave C.

#ARM 12hr - two main options, multi 1-2 and a zigzag. Price should hold 90.5 for the bulls.


#USOIL 1hr - short hit minimal target. Minimal common time for a zigzag aligns with NY close but can take longer. If it keeps dropping under 75 will consider a wave 3 instead of C.

#ALAB 1D - if that's a multi 1-2, it might launch a wave 3 the next time it pokes at the top of those base channels


#NKE 1M - this EW scenario fits well, imo. Can it be something else? Sure. Is it worth a shot looking for an entry on lower time frames? Maybe.
Also a potential weekly cycle low.


#INTC 4 hr - the two main options here are completing a zigzag around 64-67 or going for an impulse with much lower levels. I am a bit biased towards the zigzag but it doesn't matter until we see a long setup on the 1hr.


#NUE 1D - seems like it might find a bottom between 200 and 240 in the next daily cycle low in November


#CRWV 12hr and 1hr EW analysis. Multiple possible scenarios. Both a complete or incomplete corrective structure at the 58.9 low.


