

Stage Analysis Screener & Market Breadth Tools Stock Trading & Investing – Stan Weinstein's Stage Analysis & Wyckoff ➜ Join: https://xitter.gq/t.co/mtOKZZIXec
Joined February 2013
- Tweets22.9K
- Following772
- Followers42.2K
- Likes7.7K


Pinned Tweet
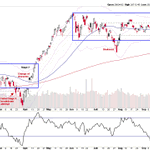
Stage Analysis – The Four Stages
******************************
Thread:
Examples of each of the Four Stages to help you learn Stan Weinstein's Stage Analysis method.
Also will help you understand what I'm referring to in my posts
#stanweinstein #stageanalysis #stocks #study

Stage Analysis retweeted
Stage Analysis Screener – Stage 4 Breakdowns/Transitions & Continuation Breakdown Attempts
SNDK, INTC, GOOGL, HOOD, NOW, COIN, NU, FCX, RDDT, TT, KEYS, XP, ITUB, FFIV, UMC, SCCO, RMBS, HLN, BBD, SAN, BAP, CSAN, AIT, LOGI, ABEV, HMY, SBS, BFAM, CACC, SBSW, INTR, EDU, PPLI, DAN, LAUR, BBVA, NG, INBX, IDYA, UGP, DLO, PLPC, FELE, ATEC, GRND, BSBR, SATL, STRA
Filters:
Stage: 4A, 4, 4B
Stage Change: Stage Changed
Market Cap: +Mini (over $300mln)
WCR: Close in Lower Quarter of Bar
Avg $ Volume: Over 100M
Sort order: Average Dollar Volume

Stage Analysis retweeted
Stage Analysis Screener – Stage 2 Breakouts & Continuation Breakouts
AZN, WEC, GEHC, LYB, CROX, FTV, ERIC, CUBE, ADT, MIR, CPRI, FCN, CVCO, PBA, COLM, RDY, KMPR, OSW, HWKN
Filters:
Stage: 2A, 2, 2B
Stage Change: Stage Changed
Market Cap: +Mini (over $300mln)
WCR: Close in Upper Quarter of Bar
Avg $ Volume: Over 100M
Breakout: 13W Breakout – Cross Above 13W High
Sort order: Average Dollar Volume
The purpose of this scan is to find stocks attempting to breakout into Stage 2 and continuation breakouts already in Stage 2

Stage Analysis retweeted
Stage Analysis Weekend Video – $SPY, $QQQ, $GOOGL, $TSLA and much more...
▪️FREE full length video (50mins) available to everyone discussing all the data for the Stage Analysis method (made famous in Stan Weinstein's classic book)
stageanalysis.net/blog/14205…

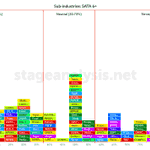
Market Breadth: Percentage of Technically Healthy Stocks (SATA 6+) per sub-industry group
Colour coded by sector

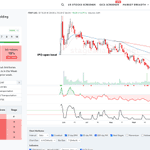
$FDXF earnings reaction in Stage 4- with a clear change of behaviour on heavy volume.
**AI Summary of the FDXF page on the Stage Analysis website using Claude**
FDXF is still in Stage 4, but last week it made its first real reversal attempt since the spin-off.
**Last week**
- The trigger was earnings. FedEx Freight reported its first results as a standalone company on Thursday after the close. Revenue was $3.28B, up 9%. The adjusted operating ratio improved 90bps to 84.5%. Guidance is for Q4 adjusted operating income up about 20% at the midpoint.
- The numbers have soft spots. Tonnage was flat, and adjusted EPS of $2.15 was down $0.70 year on year. Pricing excluding fuel rose only 0.3%, so most of the revenue growth came from fuel surcharges.
- Friday gapped up and closed at 126.04, up 14.9%, on about 3.6M shares. That's roughly 2–3× normal daily volume.
- The weekly bar is a reversal week. It made a new low since listing at 103.47, then closed at 126.04, near the 128 high. The week closed in the top 92% of its range.
- Weekly volume was only about 1.2× its 10-week average. That's light for a convincing selling climax.
**Stage picture**
- **Stage:** 4-, after 19 weeks of decline from 160.37. It fell as much as 35% and has now bounced 22% off the low.
- **Price vs the 30-week MA:** price is 10.6% below the 30-week MA at 139.36, and that average is still falling. With only about 22 weeks of trading since the late-May listing, the 30- and 40-week MAs are both just an average of all the data so far.
- **Price vs the 10-week MA:** price has crossed back above it, at 120.22.
- **Relative strength (Mansfield RS):** the weekly reading is still negative at −9.5, though up 12 points. The daily reading turned positive (+7) for the first time since June.
- **Score and group:** the weekly SATA score is 2/10, up from 0. The sector and sub-industry are both rated very weak, at 16% and 18%.
**Levels that matter**
- **103.47:** the reversal low. A break below it would cancel the attempted turn.
- **110.6–115.2:** the gap zone. A good sign would be pullbacks holding at or above it.
- **~137–139:** the falling 200-day and 30-week MAs. This is the first real overhead resistance.
- **150.29:** the site's next Stage 2 trigger, 19% above the current price. It's also the 13-week closing high.
- **158.35:** the 13-week high.

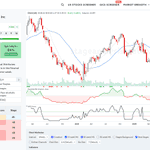
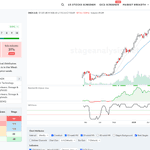
$CELH currently in Stage 4B- and has been building a base for the last 6 months which might be a potential Stage 1 base.
Earnings: 2026-11-05 (BMO)

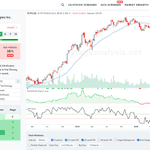
$PLTR dropped below its 10 week moving average on Friday, moving it into Stage 2-
But could the recent upthrust to new all time highs and subsequent failure be part of a larger double top pattern?

$SNDK with a Stage 4 breakdown "attempt"


Grok, describe Stan Weinstein's Stage 3 to 4 in a stock:
**Stan Weinstein’s Stage 3 (topping/distribution) and Stage 4 (declining)** represent the second half of the market cycle, where an advance ends and a downtrend takes hold. While the method itself is primarily technical—centered on the weekly chart and the 30-week moving average—the surrounding sentiment and fundamentals typically reinforce (or lag) what the price action is already showing.
In **Stage 3**, the technical picture is one of a volatile sideways range after a prolonged advance: the 30-week moving average flattens, price chops above and below it, and volume is often heavy without net progress as large holders distribute shares. Fundamentals frequently still look strong or even excellent—earnings growth continues, margins hold up, and analysts remain constructive. Sentiment is usually very bullish or euphoric. Media coverage is positive, retail interest is high, and the narrative often centers on how the company (or sector) is “different this time” and will keep rising. This mismatch is classic: the best fundamental and sentiment backdrop of the entire cycle often occurs while smart money is quietly selling into strength, which is why Stage 3 is so deceptive and why many investors hold through the top.
**Stage 4** begins with a decisive break below the Stage 3 support range and a turn lower in the 30-week moving average, producing lower highs and lower lows. Early in the decline, trailing fundamentals can still appear acceptable or “cheap” on historical metrics, and some bulls continue to argue that the sell-off is an overreaction or a buying opportunity. Sentiment gradually shifts from denial (“it’s just a healthy correction”) to growing concern and eventually fear as negative headlines, earnings disappointments, guidance cuts, or competitive pressures emerge. Relative strength stays weak, rallies fail beneath the falling average (usually on lighter volume), and the stock that once looked expensive now looks cheap—yet Weinstein’s explicit rule is to avoid new long positions precisely because cheap can become much cheaper while the primary trend is down.
The practical takeaway is that Stage 3–4 is the period in which fundamentals and sentiment most often lag or contradict the technical evidence. Stage 3 rewards those who reduce exposure while the story is still positive; Stage 4 punishes those who buy the dip or hold on the basis of improving (or merely stabilizing) fundamentals. The cycle eventually completes when selling exhausts itself, the moving average flattens, and a new Stage 1 base forms—usually only after sentiment has turned thoroughly negative and fundamentals have deteriorated.

Stage Analysis Weekend Video – $SPY, $QQQ, $GOOGL, $TSLA and much more...
▪️FREE full length video (50mins) available to everyone discussing all the data for the Stage Analysis method (made famous in Stan Weinstein's classic book)
stageanalysis.net/blog/14205…
Stage Analysis Screener – Stage 2 Breakouts & Continuation Breakouts
AZN, WEC, GEHC, LYB, CROX, FTV, ERIC, CUBE, ADT, MIR, CPRI, FCN, CVCO, PBA, COLM, RDY, KMPR, OSW, HWKN
Filters:
Stage: 2A, 2, 2B
Stage Change: Stage Changed
Market Cap: +Mini (over $300mln)
WCR: Close in Upper Quarter of Bar
Avg $ Volume: Over 100M
Breakout: 13W Breakout – Cross Above 13W High
Sort order: Average Dollar Volume
The purpose of this scan is to find stocks attempting to breakout into Stage 2 and continuation breakouts already in Stage 2
Scan for stocks that meet the Stage Analysis criteria on stageanalysis.net – a dedicated platform for the Stage Analysis method with unique tools and features that will save you time in your daily/weekly research.

Stage Analysis Screener – Stage 4 Breakdowns/Transitions & Continuation Breakdown Attempts
SNDK, INTC, GOOGL, HOOD, NOW, COIN, NU, FCX, RDDT, TT, KEYS, XP, ITUB, FFIV, UMC, SCCO, RMBS, HLN, BBD, SAN, BAP, CSAN, AIT, LOGI, ABEV, HMY, SBS, BFAM, CACC, SBSW, INTR, EDU, PPLI, DAN, LAUR, BBVA, NG, INBX, IDYA, UGP, DLO, PLPC, FELE, ATEC, GRND, BSBR, SATL, STRA
Filters:
Stage: 4A, 4, 4B
Stage Change: Stage Changed
Market Cap: +Mini (over $300mln)
WCR: Close in Lower Quarter of Bar
Avg $ Volume: Over 100M
Sort order: Average Dollar Volume
Scan for stocks that meet the Stage Analysis criteria on stageanalysis.net – a dedicated platform for the Stage Analysis method with unique tools and features that will save you time in your daily/weekly research.
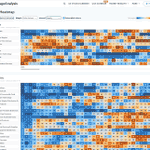
GICS Heatmap of the Sectors, Groups, Industries and Sub-industries on the Stage Analysis website
Health Care taking the lead from Energy this week. But most notable has been the continued declines in Technology (1st to 8th in 5 weeks) and Communication Services (now bottom)

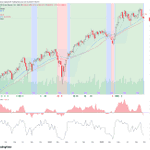
New Blog Post: Market Breadth: Percentage of Stocks Above their 50 Day, 150 Day & 200 Day Moving Averages Combined
▪️37.38% (+1.19% 1wk)
Status: Neutral Environment
stageanalysis.net/blog/14194…


