
"Do one's utmost as a human being, then await the will of Heaven."
korea
Joined May 2026
- Tweets3.7K
- Following275
- Followers1.7K
- Likes4K



Pinned Tweet
"This account serves as a personal log for macro chart fractals and data-driven analysis.
No investment or purchase recommendations are made here.
Inquiries regarding target prices or timelines will be systematically disregarded or blocked.
Invest at your own risk."


As an analyst, I find myself driven by a touch of greed insisting that this specific outlook will unfold.
yet, because the X and Y-axis timelines have completely diverged from previous trajectories, it is impossible to even attempt a prediction of the timeline itself.
1
215
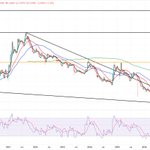
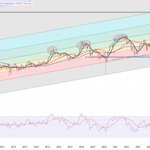
This is the $BTC.D chart, generated using the same tools applied to the previously mentioned $OTHERS.D chart.


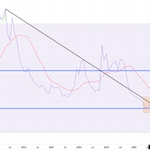
The $USDT.D chart, created using the same tools as those used for the aforementioned $OTHERS.D chart.
It offers a greater level of precision compared to the more commonly used $OTHERS.D and $USDT.D charts. (Relatively few errors)


14
970


$usdt.d
Just shut up and DCA.
No explanation is necessary.
It is better to say less that way, you attract fewer flies.
One understands only as much as one’s intelligence allows.


$btc.d
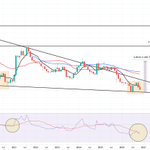
Looking at a smaller timeframe, we can see that an all-time high has been reached since 2022.
The silver lining is the potential for a bearish divergence.
however, if the period between the initial breakout and the subsequent reversal drags on,


1
18
2,650