

Enhance your investments and trading strategy with our indicators. Optimize your Entry Points. Extend your Take Profits. Minimize your Stop Loss.
Wyoming, USA
Joined December 2020
- Tweets13.6K
- Following411
- Followers10.6K
- Likes3K






Bitcoin
You may have heard us say that the crypto market "lacks liquidity." 80% of the time, the price is manipulated to liquidate positions. We explain why this happens, the battle between bots, and how this affects your trading.

Visita nuestra web y conoce nuestras herramientas para traders de #Bitcoin y #altcoins y holders de #BTC youtube.com/watch?v=c88DDQe3…
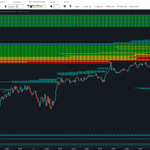
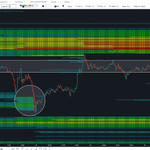
Herramientas como Liquidation Heatmap y High Frequency permiten anticipar áreas clave, otorgándole al trader una ventaja real al momento de proyectar movimientos y operar con mayor precisión. #Bitcoin Ejemplo:
tradingdifferent.com/es/dash…


El backtesting es fundamental en el desarrollo de una estrategia de trading sólida.
La herramienta #Backtest te permite elegir días específicos para estudiar el comportamiento del precio, identificar patrones recurrentes y evaluar el rendimiento de tus estrategias antes de aplicarlas en tiempo real. #Bitcoin
tradingdifferent.com/es/dash…

📊 #BTC | Bitcoin spot ETF flows · Oct 29
🟢 Net flow: +211 BTC
By fund:
• IBIT: +157 BTC
• FBTC: +129 BTC
• BITB: +108 BTC
• MSBT: +52 BTC
• BTCW: –47 BTC
• BTC (Grayscale Mini): –188 BTC
🔎 The ETFs weren't behind the drop:
• On the day BTC broke from ~$81.9K to $76.4K, the ETFs closed slightly positive.
• It's the fourth day of inflows in a row, ~5,450 BTC since Oct 26.
• The selling came from derivatives: ~$170M in long liquidations in two candles.
Leverage got flushed, and the institutional money stayed put.
Track ETF holdings with Trading Different.
👉 tradingdifferent.com/dashboa…
#Bitcoin #ETF #Crypto #BTC

📊 #BTC | Aggregated data in 1h
BTC broke the range and dropped from ~$81.95K to a $76,444 low. It's now trading at $77,150.
🔹 Liquidations: the biggest long flush of the period, with two candles near $100M and ~$70M. The leveraged longs stacked under the range got wiped out.
🔹 Coinbase spot: heavy volume during the drop, with peaks near 100M. Spot was active on the way down.
🔹 Open Interest: $38.49B. It whipsawed during the drop and is still around $38.5B, with no clean flush.
🔹 Hyperliquid: peaks near 800M at the low, the highest of the period.
Longs got flushed hard, but OI hasn't reset. There's still leverage in the market.
Do your own monetary analysis with Trading Different.
👉 tradingdifferent.com/es/dash…
#Bitcoin #BTC #Crypto #Liquidations #OpenInterest

Trading Different retweeted

📍 bitcoin:native | Cerca del segundo imán: los 10x esperan en los 74.739
Bitcoin no se frenó en el primer bloque. Ayer barrió los longs de 79.134 y hoy siguió bajando hasta 76.444, el nuevo mínimo del recorte. Rebotó hasta ~78.800 y vuelve a bajar: ahora cotiza en 77.341.
⚡ Las franjas de longs entre 77.000 y 79.100 ya se consumieron con la caída.
🔻 Abajo, el segundo imán:
• 73.100–76.444: el bloque más intenso del mapa, que arranca justo debajo del nuevo mínimo. El núcleo, en rojo, está en 74.739, a un ~3,4% del precio.
• Es la zona que se veía al sumar el 10x al mapa. Ahí está el apalancamiento más bajo, que aguanta más antes de liquidarse.
• Más abajo, entre 70.000 y 72.600, hay otras franjas cargadas.
🔺 Arriba: solo hay líneas finas cerca de 83.000 y el bloque de 84.875.
Primero cayeron los 25x a 100x. Ahora queda por ver si el precio llega a buscar a los 10x.
El mapa no indica la dirección del precio. Muestra dónde están las posiciones apalancadas que serían liquidadas si el precio llega a esos niveles.
#BTC
🔗 tradingdifferent.com/code/rT…

Trading Different retweeted
📍 $ETH | El bloque de longs, casi barrido por completo
Ethereum terminó de bajar hasta 2.172, el nuevo mínimo del recorte. En dos días atravesó casi todo el bloque de longs de 2.160–2.281, que era la mayor concentración del mapa, núcleo de 2.267 incluido. Hoy rebota y cotiza en 2.242, en la zona de 2.246.
🔻 Abajo: solo queda una franja chica entre 2.150 y 2.172, justo debajo del nuevo mínimo.
🔺 Arriba: en la parte visible del mapa no quedan franjas activas de shorts.
El precio "limpió" el mapa: la liquidez de longs que venía acumulándose desde el día 24 ya se liquidó. Sin imanes cerca, el próximo movimiento va a depender de dónde se vuelva a armar apalancamiento.
El mapa no indica la dirección del precio. Muestra dónde están las posiciones apalancadas que serían liquidadas si el precio llega a esos niveles.
#ETH
🔗 tradingdifferent.com/code/rT…

BTC on #Hyperliquid 15 min chart 📊
Bitcoin breaks down through the bullish structure it had been building and falls with a vertical move that has accumulated a decline of more than 5%. ⚖️📉
Above, $79,000 is a zone that price cut through during this drop and where short sellers’ liquidity had been building up, and it is the level to recover if buyers want to win back part of what was lost. 🎯🚀
Below, $74,800 holds the nearest pending liquidity and would come into focus if the selling does not let up. 📉🧲
See the Liquidation Heatmap here:
👉 tradingdifferent.com/es/dash…
#BTC #Bitcoin #Crypto #LiquidationMap #LiquidityMap

Trading Different retweeted
📍 bitcoin:native | Barrió el bloque de los 79.134
En una sola vela, Bitcoin cayó desde ~80.800 hasta 78.210 y perforó el mínimo de 79.178, que venía sosteniendo hace seis días. Entró de lleno en el bloque de longs de 79.134 y liquidó la parte alta, hasta los 78.210. Ahora rebota a 79.185.
🔻 Abajo:
• 77.200–78.200: queda activa la parte baja del bloque, justo debajo del nuevo mínimo.
• ~76.400–76.800: otra franja cargada más abajo.
🔺 Arriba, entre 82.035 y 83.300: siguen las franjas de shorts, por encima del máximo del recorte.
Fue la zona que venimos marcando: seis días de rango encima de un bloque que no paraba de crecer, y el precio fue a buscarlo.
El mapa no indica la dirección del precio. Muestra dónde están las posiciones apalancadas que serían liquidadas si el precio llega a esos niveles.
#BTC
🔗 tradingdifferent.com/code/rT…

Trading Different retweeted
📍 cardano:native | Barrió el bloque de 0,1877 y rebotó
Cardano cayó hasta 0,1871, el nuevo mínimo del recorte. En el camino barrió las franjas de longs entre 0,1925 y 0,2000 y el bloque en rojo de 0,1877, que era la mayor concentración del mapa. Desde ahí rebotó con fuerza y cotiza en 0,1942.
🔻 Abajo:
• 0,1800–0,1871: queda activa la parte baja del bloque, justo debajo del nuevo mínimo.
• 0,1730–0,1790: otra franja más abajo.
🔺 Arriba:
• 0,2085–0,2115: una franja de shorts, a un ~8% del precio.
• 0,2175–0,2255: más franjas por encima.
Igual que BTC hoy, el precio fue a buscar el bloque de longs que venía marcando el mapa y reaccionó apenas lo tocó.
El mapa no indica la dirección del precio. Muestra dónde están las posiciones apalancadas que serían liquidadas si el precio llega a esos niveles.
#ADA
🔗 tradingdifferent.com/code/rT…

Trading Different retweeted
📍 $ETH | Barrió el núcleo de los 2.267
Con la caída de la tarde, Ethereum perforó el mínimo de 2.281 y bajó hasta 2.230. Entró en el bloque de longs más pesado del mapa y liquidó su parte alta, núcleo en rojo de 2.267 incluido. Ahora rebota a 2.290.
🔻 Abajo:
• 2.150–2.230: queda activa la parte baja del bloque, justo debajo del nuevo mínimo.
• 2.080–2.130: líneas más finas.
🔺 Arriba:
• 2.385–2.405 y 2.420–2.440: franjas de shorts.
• 2.525–2.600: un bloque más amplio.
Es el mismo movimiento que tuvieron hoy BTC y ADA: el precio fue a buscar el bloque de longs que marcaba el mapa y rebotó apenas lo barrió.
El mapa no indica la dirección del precio. Muestra dónde están las posiciones apalancadas que serían liquidadas si el precio llega a esos niveles.
#ETH
🔗 tradingdifferent.com/code/rT…

Trading Different retweeted

SHORT A BITCOIN I @tradingdiff
🔴 EN VIVO acá: youtube.com/live/JnBvkk0IpY8

Backtest 20/11/23
Una de las formas más eficientes de enfrentar el mercado de #Bitcoin, donde la manipulación aún juega un papel importante, es validar previamente una estrategia mediante datos históricos.
La herramienta Backtest permite analizar el comportamiento pasado del precio, identificar patrones recurrentes y cuantificar la efectividad de una estrategia antes de aplicarla en tiempo real, aumentando así la probabilidad de éxito.
tradingdifferent.com/es/dash…

La liquidez continúa siendo uno de los principales factores que condicionan los movimientos de #Bitcoin. A través de Liquidation Heatmap es posible identificar las zonas donde se concentra una mayor cantidad de posiciones apalancadas y evaluar su potencial, a la hora de atraer al precio.
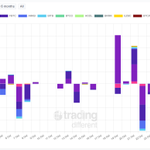
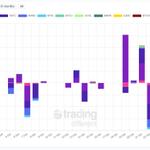
Por otro lado, High Frecuency grafica la actividad de bots que ejecutan cientos de trades por segundo para manipular el precio. Ejemplo:
tradingdifferent.com/es/dash…


📊 #BTC | Bitcoin spot ETF flows · Oct 28
🟢 Net flow: +1,688 BTC
By fund:
• IBIT: +1,672 BTC
• BITB: +16 BTC
📈 Context:
• It's the third day of inflows in a row, after +1,376 BTC (Oct 26) and +2,175 BTC (Oct 27).
• That's ~5,240 BTC in three sessions, which recovers more than half of the ~9,500 BTC that left on Oct 22–23.
• ETFs keep accumulating while BTC ranges between $79K and $82K.
Track ETF holdings with Trading Different.
👉 tradingdifferent.com/dashboa…
#Bitcoin #ETF #Crypto #BTC

📊 #BTC | Aggregated data in 1h
BTC jumped from ~$80.1K to ~$81.95K today and is easing to $81,040. It's still holding the range above the $79,178 low.
🔹 Coinbase spot: peaks near 55M on the jump, with real spot behind the move.
🔹 Open Interest: $38.90B. It rose with the jump and is already slipping, so new leverage isn't sticking.
🔹 Liquidations: small. Some shorts got flushed on the push. Earlier today the dip to ~$79.8K took out ~$15M in longs, and the current candle shows $863K in longs.
🔹 Hyperliquid: 82M, with a peak near 350M on the move.
Spot-led pushes keep getting sold near $82K, and derivatives don't follow through.
Do your own monetary analysis with Trading Different.
👉 tradingdifferent.com/es/dash…
#Bitcoin #BTC #Crypto #Liquidations #OpenInterest

Trading Different retweeted
📍 bitcoin:native | Dos imanes de longs abajo
Bitcoin cotiza en 81.059. Hoy saltó desde ~79.800 hasta ~81.950 y retrocedió. Lleva seis días en rango encima del mínimo del 24, en 79.178.
🔻 Abajo, dos bloques de longs:
• 77.200–79.134: el más cercano. El núcleo, en rojo, está en 79.134, a un ~2,4% del precio y pegado al mínimo del rango.
• 75.000–76.900: un segundo bloque que se intensificó. El núcleo, también en rojo, está en 75.513, a un ~6,8%.
🔺 Arriba, entre 82.000 y 83.300: con el salto de hoy aparecieron franjas nuevas de shorts, más finas que los bloques de abajo.
El rango sigue firme, pero debajo ya hay dos escalones de apalancamiento long. Si el precio pierde el primero, el segundo queda como siguiente imán.
El mapa no indica la dirección del precio. Muestra dónde están las posiciones apalancadas que serían liquidadas si el precio llega a esos niveles.
#BTC
🔗 tradingdifferent.com/code/rT…

Trading Different retweeted
🔴 EN VIVO
Liquidación perfecta de cortos 100x. Ahora se viene esto!
👉 Entrá ahora: youtube.com/watch?v=w0FRVoXe…

MSTR on 5 min chart 📊
MicroStrategy breaks higher out of the sideways zone it had been respecting, with a vertical push that leaves it at the doorstep of a liquidity-loaded area. ⚖️📈
On the upside, $146.00 is the nearest liquidity and would be within reach if the momentum holds its strength. 🎯🚀
If the breakout fails to hold and price returns inside that zone, $137.60 stands as the most relevant pending liquidity block to the downside. 📉🧲
See the Liquidation Heatmap here:
👉 tradingdifferent.com/es/dash…
#MSTR #MicroStrategy #Stocks #LiquidationHeatmap #StockMarket #PriceAction #WallStreet #Trading

BTC on #Hyperliquid 15 min chart 📊
Bitcoin is trying to hold in the upper part of the visible structure, with an advance that has hit the upper zone twice without managing to break it. 📈
To the upside, $81,900 is the nearest pending liquidity, just above the latest wicks, and it would come into focus on a firm breakout. 🎯🚀
If price loses ground and gives back part of the recovery, $79,700 stands as the destination of a deeper correction, with a liquidity block that is still untouched. 📉🧲
See the Liquidation Heatmap here:
👉 tradingdifferent.com/es/dash…
#BTC #Bitcoin #Crypto #LiquidationHeatmap #LiquidityZones
