

Authenticity in Every Chart, Integrity in Every Number. SEC Filings. Only Truth, No Hype. Not Financial Advice. DYODD © 2026 TrueGrids
Seattle, US
Joined January 2025
- Tweets3K
- Following0
- Followers1K
- Likes1.8K




$RUM Q3 FY2026 | Where Rumble's cash went
Rumble used $48M in operating cash flow, improving 3.7% Q/Q but up 348.7% from the $11M burn a year ago. Bitcoin sales of about $15M helped fund about $32M in equipment spending.
𝗙𝗶𝗻𝗮𝗻𝗰𝗶𝗻𝗴 𝗮𝗰𝘁𝗶𝘃𝗶𝘁𝗶𝗲𝘀 | $0.859M net inflow
-> About $0.97M received from warrant and stock option exercises
-> About $0.11M paid in taxes on net share settlement
𝗜𝗻𝘃𝗲𝘀𝘁𝗶𝗻𝗴 𝗮𝗰𝘁𝗶𝘃𝗶𝘁𝗶𝗲𝘀 | $18M net outflow
-> About $32M spent on property and equipment
-> About $1M spent on intangible assets
-> About $15M received from selling digital assets
Cash and cash equivalents ended at $134M, down $69M for the quarter. FX reduced cash by $4M.

87
$RUM Q3 FY26 | Cash falls as Northern Data reshapes the balance sheet
RUM Group ended September with $2.00B in assets, up 444.7% Y/Y after the Northern Data acquisition. Working capital fell to $180M from $220M in June.
𝗕𝗮𝗹𝗮𝗻𝗰𝗲 𝘀𝗵𝗲𝗲𝘁 𝘀𝗻𝗮𝗽𝘀𝗵𝗼𝘁
-> Total assets $2.00B | down 5.8% Q/Q
-> Cash and equivalents $134M | down 33.9% Q/Q
-> Net receivables and other $62M | +22.4% Q/Q
-> Net property and equipment $900M | down 1.5% Q/Q
-> Goodwill $414M | down 0.3% Q/Q
-> Current liabilities $171M | down 13.1% Q/Q
-> Convertible notes payable $359M | flat Q/Q
-> Total equity $1.34B | down 5.8% Q/Q | +344.2% Y/Y
𝗪𝗵𝗮𝘁 𝗰𝗵𝗮𝗻𝗴𝗲𝗱
-> Property and equipment made up 45% of assets, with goodwill and intangibles adding another 28.8%.
-> Total liquidity was $142.3M: $134.4M in cash plus 94.68 bitcoin valued at $7.9M. Digital assets on the balance sheet fell 45.5% Q/Q to $11M.
-> Non-controlling interest dropped $78M to $10M as RUM raised its Northern Data stake to about 98%, while paid-in capital rose $77M.
-> Convertible notes made up 55% of total liabilities.
The accumulated deficit grew $80M, in line with Q3 net loss attributable to RUM Group.
Data from RUM Group’s earnings release and SEC filings. Chart by TrueGrids.

4
236
$RUM Q3 FY2026 | Revenue Nearly 4x Y/Y, but an $85M D&A Charge Keeps Losses Deep
Rumble reported $96.6M of revenue, up 290% Y/Y and 139% Q/Q, and gross margin expanded to 41%. However, D&A of $85.2M pushed operating expenses to $124.0M, resulting in an $84.6M operating loss.
𝗞𝗲𝘆 𝗡𝘂𝗺𝗯𝗲𝗿𝘀
-> Revenue: $96.6M | +139.3% Q/Q | +290.0% Y/Y
-> Gross Profit: $39.4M | +303.6% Q/Q | +8,721.8% Y/Y
-> Operating Loss: $84.6M
-> Pre-Tax Loss: $90.9M
-> Net Loss: $79.9M
-> Diluted EPS: -$0.19
-> Gross Margin: 41%
-> Operating Margin: -88%
-> Net Margin: -83%
𝗖𝗼𝘀𝘁 𝗦𝘁𝗿𝘂𝗰𝘁𝘂𝗿𝗲
-> Cost of Revenue: $57.2M | +86.8% Q/Q | +126.8% Y/Y
-> Operating Expenses: $124.0M | +54.0% Q/Q | +392.6% Y/Y
-> D&A: $85.2M | +422.9% Q/Q | +2,095.2% Y/Y
-> G&A: $25.9M | +58.8% Q/Q | +147.1% Y/Y
-> R&D: $7.7M | +13.7% Q/Q | +73.4% Y/Y
-> S&M: $7.7M | -25.9% Q/Q | +51.5% Y/Y
-> Acquisition-Related Transaction Costs: $3.5M | -87.5% Q/Q | -32.3% Y/Y
-> Change in Fair Value of Digital Assets: $6.0M gain
𝗡𝗼𝗻-𝗢𝗽𝗲𝗿𝗮𝘁𝗶𝗻𝗴 𝗜𝘁𝗲𝗺𝘀
-> Net Interest: -$3.7M
-> Change in Fair Value of Derivative: -$1.6M
-> Other Expense: -$1.5M
-> Change in Fair Value of Warrant Liability: $0.6M gain
-> Income Tax: -$1.8M | Deferred Tax Benefit: $2.8M
-> Loss Attributable to Non-Controlling Interest: $9.9M
𝗟𝗶𝗾𝘂𝗶𝗱𝗶𝘁𝘆
-> Total Liquidity: $142.3M
-> Cash & Equivalents: $134.4M
-> Bitcoin: 94.68 BTC valued at $7.9M
𝗤𝟰 𝗢𝘂𝘁𝗹𝗼𝗼𝗸
-> Revenue: $88M – $94M
𝗪𝗵𝗮𝘁 𝗖𝗵𝗮𝗻𝗴𝗲𝗱
-> Revenue increased nearly 4x Y/Y and more than doubled Q/Q
-> Gross margin expanded to 41% from near zero a year ago
-> D&A increased more than 20x Y/Y to $85.2M
-> Operating expenses nearly 5x Y/Y
-> Operating margin improved to -88% from -176% last quarter
-> Net loss finished at $79.9M, roughly flat Q/Q
-> EPS loss narrowed to -$0.19 Q/Q but widened from -$0.06 Y/Y
𝗕𝗼𝘁𝘁𝗼𝗺 𝗟𝗶𝗻𝗲
Rumble is showing a step-change in scale, with revenue near $100M a quarter and a gross margin that is now meaningful.
The key number beneath the headline is D&A: $85.2M of it accounted for roughly two-thirds of operating expenses. Q4 guidance of $88M–$94M points to a slight Q/Q dip in revenue, while $142.3M of liquidity funds the ongoing losses.

1
4
234
$CRWV Q3 FY2026 | Where CoreWeave’s cash went
CoreWeave generated $1.975B in operating cash flow, up 16.9% Y/Y.
𝗙𝗶𝗻𝗮𝗻𝗰𝗶𝗻𝗴 𝗮𝗰𝘁𝗶𝘃𝗶𝘁𝗶𝗲𝘀 | $7.361B net inflow
-> $10.301B received from debt issuance, net
-> $2.344B in debt repayments
-> $566M spent on capped calls related to convertible notes
-> $30M in other financing outflows
𝗜𝗻𝘃𝗲𝘀𝘁𝗶𝗻𝗴 𝗮𝗰𝘁𝗶𝘃𝗶𝘁𝗶𝗲𝘀 | $9.836B net outflow
-> $9.441B spent on property, equipment and capitalized internal-use software
-> $410M invested in unconsolidated joint ventures and variable interest entities
-> $35M spent on strategic investments
-> $46M spent on marketable securities
-> $53M received from securities maturities and sales
-> $43M in other investing inflows
Cash, cash equivalents and restricted cash ended at $6.404B, down $500M during the quarter.

2
336
$CRWV Q3 FY26 | AI buildout pushes assets past $91B
CoreWeave added $14.4B in assets during the quarter, while debt and lease obligations continued to grow.
𝗕𝗮𝗹𝗮𝗻𝗰𝗲 𝘀𝗵𝗲𝗲𝘁 𝘀𝗻𝗮𝗽𝘀𝗵𝗼𝘁
-> Total assets $91.48B | +178.0% Y/Y
-> Cash & equivalents $4.12B | -25.4% Q/Q
-> Property & equipment, net $56.78B | +21.5% Q/Q
-> Operating lease assets $18.92B | +14.0% Q/Q
-> Total debt $46.87B | +33.7% Q/Q
-> Operating lease liabilities $18.70B | +14.6% Q/Q
-> Current liabilities $24.39B | +16.6% Q/Q
-> Total equity $4.03B | -19.9% Q/Q
𝗪𝗵𝗮𝘁 𝗰𝗵𝗮𝗻𝗴𝗲𝗱
-> Equipment and operating lease assets now represent approximately 83% of total assets.
-> Current debt reached $10.57B against $4.12B in cash. Another $2.28B of cash is restricted.
-> Q3 cash purchases of equipment and software totaled $9.44B, versus $1.98B in operating cash flow.
-> Equity declined $999M, alongside a $709M quarterly loss and $566M spent on capped calls tied to convertible notes.
Data from CoreWeave’s earnings release and SEC filings. Chart by TrueGrids.

$RGTI Q3 FY2026 | Gross Profit More Than Doubles, While Fair-Value Gains Drive Sharp Net Loss Improvement
Rigetti reported lower Q3 revenue, but gross profit improved significantly. The quarter’s bottom line was heavily influenced by a $25.3M gain from the change in fair value of derivative warrant liabilities.
Key Numbers
-> Revenue: $1.41M | -27.5% Y/Y
-> Gross Profit: $857K | +112.1% Y/Y
-> Cost of Revenue: $554K | -64.1% Y/Y
-> Operating Expenses: $34.0M | +62.5% Y/Y
-> Operating Loss: $33.2M vs. $20.5M loss Y/Y
-> Pre-Tax Loss: $3.1M vs. $201.0M loss Y/Y
-> Net Loss: $3.1M vs. $201.0M loss Y/Y
-> Basic EPS: -$0.01 vs. -$0.62 Y/Y
-> Diluted EPS: -$0.08 vs. -$0.62 Y/Y
Operating Expenses
-> R&D: $25.5M | +69.7% Y/Y
-> S,G&A: $8.5M | +44.1% Y/Y
Other Income
-> Interest Income: $4.8M
-> Gain on derivative warrant liabilities: $25.3M
-> Total Other Income: $30.0M vs. $180.4M expense Y/Y
What Changed
-> Revenue declined 27.5% Y/Y
-> Gross profit increased 112.1% Y/Y despite lower revenue
-> Operating expenses increased 62.5% Y/Y, led by higher R&D spending
-> Operating loss widened to $33.2M
-> A $25.3M fair-value gain on derivative warrant liabilities materially reduced the reported pre-tax and net loss
-> Net loss improved to $3.1M from $201.0M Y/Y, but the improvement was primarily non-operating
Bottom Line
Rigetti’s underlying operating loss widened as the company increased investment in R&D, while revenue remained small.
The headline improvement in net loss was largely driven by fair-value accounting gains, making revenue growth, gross profit and the pace of R&D spending the more important operating metrics to watch.

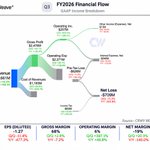
$CRWV Q3 FY2026 | Revenue +168% Y/Y, Operating Income Turns Positive as FY2026 Guidance Rises
CoreWeave delivered another quarter of explosive AI infrastructure growth, with revenue reaching $3.66B and gross profit rising 149% Y/Y. Operating income improved sharply, but heavy financing costs continue to weigh on GAAP profitability.
Key Numbers
-> Revenue: $3.66B | +42.2% Q/Q | +168.3% Y/Y
-> Gross Profit: $2.48B | +46.1% Q/Q | +148.8% Y/Y
-> Operating Income: $207M | +522.4% Q/Q | +299.2% Y/Y
-> Pre-Tax Loss: $626M
-> Net Loss: $709M
-> Diluted EPS: -$1.27
-> Gross Margin: 68%
-> Operating Margin: 6%
-> Net Margin: -19%
Cost Structure
-> Cost of Revenues: $1.18B | +34.6% Q/Q | +220.7% Y/Y
-> Operating Expenses: $2.27B | +30.1% Q/Q | +140.6% Y/Y
-> Net Interest Expense: $846M
-> Other Income: $13M
-> Income Tax Benefit: $83M
FY2026 Guidance Raised
-> Revenue: $13.0B to $13.3B
-> Adjusted Operating Income: $1.275B to $1.375B
-> Adjusted operating income midpoint increased 26% vs. prior guidance
-> CapEx: $37B to $39B, with the low end raised from $35B
-> Active power at year-end: >1.85 GW
-> Exit 2026 annualized run-rate revenue: $20B to $21B
-> Q4 interest expense expected at $1.05B to $1.15B
What Changed
-> Revenue increased 168.3% Y/Y
-> Gross profit increased 148.8% Y/Y
-> Operating income reached $207M
-> Management raised both revenue and adjusted operating income guidance
-> CapEx expectations increased as infrastructure is being deployed faster than previously planned
-> Exit run-rate revenue guidance increased to as much as $21B
Bottom Line
CoreWeave’s demand story remains exceptionally strong, with management now targeting more than $13B of FY2026 revenue and a $20B to $21B annualized exit run-rate.
The trade-off remains aggressive capital intensity and financing costs. Q4 interest expense alone is expected to reach $1.05B to $1.15B, making leverage and cash generation the key metrics to watch as CRWV scales.

$WIX Q3 FY2026 | Revenue +13% Y/Y as Base44 Investment Pressures Near-Term Profitability
Wix reported $570M of revenue, up 12.9% Y/Y, with Creative Subscriptions remaining the core revenue driver. Base44 continues to scale rapidly, but heavier sales and marketing investment is weighing on near-term free cash flow expectations.
Key Numbers
-> Revenue: $570M | +1.3% Q/Q | +12.9% Y/Y
-> Gross Profit: $386.8M | +4.4% Q/Q | +12.0% Y/Y
-> Operating Loss: $16.4M
-> Pre-Tax Loss: $16.3M
-> Net Loss: $13.7M
-> Diluted EPS: -$0.32
-> Gross Margin: 68%
-> Operating Margin: -3%
-> Net Margin: -2%
Revenue Mix
-> Creative Subscription: $406.7M | 71.3% of revenue | +14.2% Y/Y
-> Business Solutions: $163.5M | 28.7% | +9.7% Y/Y
Cost Structure
-> Cost of Revenues: $183.3M | +14.6% Y/Y
-> Operating Expenses: $403.2M | +14.3% Y/Y
-> S&M: $193.2M | +40.6% Y/Y
-> R&D: $169.4M | -1.5% Y/Y
-> G&A: $40.6M | -6.0% Y/Y
FY2026 Outlook
-> Revenue growth maintained at low-to-mid-teens Y/Y
-> Bookings growth expected in the low-teens Y/Y
-> Q4 revenue growth expected in the low-double-digits Y/Y
-> Q4 bookings growth expected to lag revenue growth due to near-term Partners softness
-> FCF margin excluding acquisition-related and restructuring costs now expected at ~16%, down from high-teens previously
-> Base44 non-GAAP gross margin expected around 60% in 2H and above 60% exiting the year
Base44
-> ARR has reached nearly $250M
-> Management expects growth to ramp through the second half
-> Majority of subscriptions are billed monthly
-> Wix is reinvesting gross margin improvement into Base44 sales and marketing to capture elevated demand
What Changed
-> Revenue increased 12.9% Y/Y
-> Creative Subscription revenue increased 14.2%
-> S&M spending increased 40.6% Y/Y
-> Wix maintained its top-line guidance
-> FCF margin outlook was reduced to ~16%
-> Management expects Base44 ARR momentum to convert into stronger bookings and revenue over coming quarters
Bottom Line
Wix’s core business continues to grow at a double-digit rate, but the bigger story is Base44.
Management is deliberately sacrificing some near-term FCF margin to accelerate customer acquisition, with Base44 already approaching $250M of ARR and expected to become a larger contributor to bookings and revenue.

$WIX Q3 FY26 | Deposit proceeds lift cash to $703M
Wix’s cash rose $441M from June. It received $345M in proceeds from short-term and restricted deposits and generated $78M in operating cash flow.
𝗕𝗮𝗹𝗮𝗻𝗰𝗲 𝘀𝗵𝗲𝗲𝘁 𝘀𝗻𝗮𝗽𝘀𝗵𝗼𝘁
-> Total assets $1.90B | down 25.8% Y/Y
-> Cash and equivalents $703M | +167.7% Q/Q
-> Marketable securities $332M | down 3.1% Q/Q
-> Current deferred revenue $784M | +7.6% Y/Y
-> Current liabilities $1.81B | +68.0% Y/Y
-> Current credit facility loans $500M | flat Q/Q
-> Convertible notes, net $1.13B | +0.5% Y/Y
-> Shareholders’ equity -$1.69B | vs. -$279M a year ago
𝗪𝗵𝗮𝘁 𝗰𝗵𝗮𝗻𝗴𝗲𝗱
-> Cash, marketable securities and short-term deposits rose $85M Q/Q to $1.05B.
-> The working capital deficit narrowed to $649M from $700M in June. Deferred revenue made up 43% of current liabilities.
-> Wix repurchased 17.6M shares in April’s $1.62B tender offer and drew $500M on its credit facility in Q2.
-> The shareholders’ equity deficit narrowed by $51M Q/Q as paid-in capital increased.
Data from Wix’s SEC filings. Chart by TrueGrids.

$SE Q3 FY26 | Deposits grow faster than loans
Sea’s assets climbed 3.7% Q/Q. Deposits payable rose $1.07B, while net loan receivables increased $985M.
𝗕𝗮𝗹𝗮𝗻𝗰𝗲 𝘀𝗵𝗲𝗲𝘁 𝘀𝗻𝗮𝗽𝘀𝗵𝗼𝘁
-> Total assets $33.20B | +24.1% Y/Y
-> Net loan receivables $10.60B | +56.9% Y/Y
-> Cash and equivalents $2.91B | down 17.7% Q/Q
-> Short-term investments $5.11B | down 8.2% Q/Q
-> Long-term investments $3.27B | +18.7% Q/Q
-> Deposits payable $5.36B | +25.0% Q/Q
-> Current liabilities $16.83B | +4.6% Q/Q
-> Total equity $13.45B | +30.6% Y/Y
𝗪𝗵𝗮𝘁 𝗰𝗵𝗮𝗻𝗴𝗲𝗱
-> Net loans made up 32% of total assets, up from 25% a year earlier.
-> Cash plus short-term investments fell $1.08B Q/Q to $8.02B.
-> Monee’s consumer and SME loan principal reached $12.6B across on- and off-book loans. The share more than 90 days past due rose to 1.3% from 1.0% in June.
-> Credit loss allowances on balance sheet loans increased to $1.38B from $1.11B in June.
Data from Sea’s earnings release and SEC Forms 6-K. Chart by TrueGrids.

$ONON Q3 FY26 | Cash rises as lease liabilities jump 30% Q/Q
On ended September with CHF 3.66B in assets, up 12.9% Q/Q. Cash and right-of-use assets accounted for about 73% of the increase.
𝗕𝗮𝗹𝗮𝗻𝗰𝗲 𝘀𝗵𝗲𝗲𝘁 𝘀𝗻𝗮𝗽𝘀𝗵𝗼𝘁
-> Total assets CHF 3.66B | +33.1% Y/Y
-> Cash and equivalents CHF 1.34B | +11.1% Q/Q
-> Inventories CHF 495.7M | +30.2% Y/Y
-> Trade receivables CHF 432.8M | +27.0% Y/Y
-> Right-of-use assets CHF 701.0M | +32.1% Q/Q
-> Current liabilities CHF 813.4M | +0.4% Q/Q
-> Non-current lease liabilities CHF 613.1M | +29.2% Q/Q
-> Total equity CHF 2.18B | +13.8% Q/Q
𝗪𝗵𝗮𝘁 𝗰𝗵𝗮𝗻𝗴𝗲𝗱
-> Cash rose CHF 133.4M Q/Q. On received CHF 52.6M in U.S. tariff refunds during the quarter.
-> Total lease liabilities rose CHF 170.1M Q/Q to CHF 732.6M. On cited Belgian warehouses and new store leases as the main drivers of higher lease obligations since year-end.
-> Operating working capital rose 16.5% Q/Q to CHF 740.7M as receivables and inventories increased and trade payables fell.
-> Retained earnings accounted for CHF 162.8M of the CHF 264.5M Q/Q increase in equity.
Data from On Holding’s SEC Forms 6-K. Chart by TrueGrids.

$SE Q3 FY2026 | Revenue +63% Y/Y as Shopee and Monee Drive Strong Growth
Sea delivered another strong quarter with revenue reaching $8.58B, up 63.2% Y/Y. E-commerce remained the largest contributor, while Digital Financial Services posted the fastest growth among major segments.
Key Numbers
-> Revenue: $8.58B | +10.2% Q/Q | +63.2% Y/Y
-> Gross Profit: $3.94B | +10.9% Q/Q | +63.3% Y/Y
-> Operating Income: $664M | +2.1% Q/Q | +36.2% Y/Y
-> Pre-Tax Income: $787M | +10.0% Q/Q | +37.9% Y/Y
-> Net Income: $502M | +9.7% Q/Q | +21.3% Y/Y
-> Diluted EPS: $0.78 | +11.4% Q/Q | +20.0% Y/Y
-> Gross Margin: 46%
-> Operating Margin: 8%
-> Net Margin: 6%
Revenue Mix
-> E-Commerce / Shopee: $5.32B | 62.0% of revenue | +60.7% Y/Y
-> Digital Financial Services / Monee: $1.62B | 18.9% | +83.7% Y/Y
-> Digital Entertainment / Garena: $840M | 9.8% | +50.3% Y/Y
-> Other Revenue: $749M | 8.7% | +62.5% Y/Y
-> Other Operating: $48M | 0.6% | +2.5% Y/Y
Cost Structure
-> Cost of Revenues: $4.65B | -9.6% Q/Q | -63.1% Y/Y
-> Operating Expenses: $3.27B | -12.8% Q/Q | -70.2% Y/Y
-> S&M: $1.89B
-> Credit Loss Provision: $682M
-> G&A: $425M
-> R&D: $302M
-> Other Costs: $710M
What Changed
-> Revenue increased 63.2% Y/Y
-> Shopee revenue increased 60.7% Y/Y
-> Monee revenue increased 83.7% Y/Y
-> Garena revenue increased 50.3% Y/Y
-> Gross profit increased 63.3% Y/Y
-> Operating income increased 36.2% Y/Y
-> Net income increased 21.3% Y/Y
-> EPS increased 20.0% Y/Y
Bottom Line
Sea continues to deliver broad-based growth across all three major businesses.
Shopee remains the scale engine, Monee is the fastest-growing major segment, and Garena is again contributing meaningful growth. The key watch item is whether revenue can continue compounding at this pace while operating margins expand from the current 8%.

$ONON Q3 FY2026 | Revenue Hits $931M as Operating Income Jumps 63% Q/Q
On delivered another strong quarter with revenue up 9.5% Q/Q, while operating income and net income grew substantially faster. Shoes remain the core business, while Apparel and Accessories posted the strongest sequential growth.
Key Numbers
-> Revenue: $931M | +9.5% Q/Q
-> Gross Profit: $676M | +21.6% Q/Q
-> Operating Income: $195M | +63.3% Q/Q
-> Pre-Tax Income: $212M | +68.4% Q/Q
-> Net Income: $163M | +55.0% Q/Q
-> Diluted EPS: $0.48 | +54.8% Q/Q
-> Gross Margin: 73%
-> Operating Margin: 21%
-> Net Margin: 17%
Revenue Mix
-> Shoes: $844M | 90.6% of revenue | +7.9% Q/Q
-> Apparel: $70M | 7.5% | +28.2% Q/Q
-> Accessories: $18M | 1.9% | +24.8% Q/Q
Cost Structure
-> Cost of Revenues: $256M | +13.3% Q/Q
-> G&A: $481M | -10.2% Q/Q
-> Finance Income: $11M
-> Net FX & derivative gains: $14M
-> Finance Costs: $8M
FY2026 Outlook
-> Constant-currency net sales growth: low-20% range, unchanged
-> Net sales at current FX: CHF 3.47B to CHF 3.56B
-> Gross Margin: ~67.5% including U.S. tariff refunds
-> Gross Margin excluding tariff refunds: ~66%, above prior guidance of at least 65%
-> Adjusted EBITDA Margin: 21.0% to 21.5% including tariff refunds
-> Adjusted EBITDA Margin excluding refunds: 19.5% to 20.0%, unchanged
-> Management expects net sales growth to accelerate in Q4
What Changed
-> Revenue increased 9.5% Q/Q
-> Gross profit increased 21.6% Q/Q
-> Operating income increased 63.3% Q/Q
-> Net income increased 55.0% Q/Q
-> Apparel grew 28.2% Q/Q and Accessories 24.8%
-> Gross margin outlook improved excluding the benefit from U.S. tariff refunds
Bottom Line
ONON continues to show strong operating leverage, with earnings growing much faster than revenue.
The bigger signal is the outlook: management expects Q4 growth to accelerate while maintaining premium positioning and full-price discipline, with FY2026 gross margin now expected around 66% even excluding U.S. tariff refunds.

$QBTS. Q3 FY2026 | Revenue +46% Q/Q, +46% Y/Y as Losses Remain Elevated
D-Wave reported $4.5M of revenue with strong sequential and Y/Y growth, while gross profit reached $2.4M. Heavy R&D spending continues to keep the company deeply loss-making.
Key Numbers
-> Revenue: $4.51M | +46.7% Q/Q | +45.8% Y/Y
-> Gross Profit: $2.39M | +40.0% Q/Q | +20.7% Y/Y
-> Operating Loss: $53.48M
-> Pre-Tax Loss: $48.27M
-> Net Loss: $48.20M
-> Diluted EPS: -$0.13
-> Gross Margin: 53%
-> Operating Margin: -1,185%
-> Net Margin: -1,068%
Cost Structure
-> Cost of Revenues: $2.13M | +55.0% Q/Q | +90.1% Y/Y
-> Operating Expenses: $55.87M | -1.6% Q/Q | +96.2% Y/Y
-> R&D: $31.54M | +11.7% Q/Q | +148.5% Y/Y
-> G&A: $13.10M | -14.9% Q/Q | +43.2% Y/Y
-> S&M: $11.23M | -1.1% Q/Q | +69.2% Y/Y
-> Other Income, Net: $5.22M | +103.7% Y/Y
What Changed
-> Revenue increased 45.8% Y/Y
-> Gross profit increased 20.7% Y/Y
-> Cost of revenues increased 90.1% Y/Y
-> Operating expenses nearly doubled Y/Y
-> R&D increased 148.5% Y/Y and remains the largest operating expense
-> Net loss was $48.2M despite improving 71.2% Y/Y on the chart’s comparison
-> Gross margin remained relatively strong at 53%, but the operating expense base remains far above revenue
Bottom Line
QBTS continues to post strong top-line growth, but the business is still spending aggressively relative to its current revenue scale.
The key question is whether revenue can continue compounding fast enough to absorb a $55.9M quarterly operating expense base and begin meaningfully narrowing operating losses.

$TDG Q4 FY2026 | Revenue +23% Y/Y, EPS +33% as FY2027 Guidance Points to Continued Double-Digit Growth
TransDigm closed FY2026 with strong revenue and operating growth, while net income declined modestly Y/Y. Management expects another year of double-digit sales and earnings growth in FY2027.
𝗞𝗲𝘆 𝗡𝘂𝗺𝗯𝗲𝗿𝘀
-> Revenue: $2.99B | +9.0% Q/Q | +22.6% Y/Y
-> Gross Profit: $1.76B | +8.3% Q/Q | +19.9% Y/Y
-> Operating Income: $1.36B | +11.2% Q/Q | +17.5% Y/Y
-> Pre-Tax Income: $778M | +9.1% Q/Q | +3.5% Y/Y
-> Net Income: $586M | +8.7% Q/Q | -3.9% Y/Y
-> Diluted EPS: $10.33 | +10.0% Q/Q | +33.3% Y/Y
-> Gross Margin: 59%
-> Operating Margin: 46%
-> Net Margin: 20%
𝗖𝗼𝘀𝘁 𝗦𝘁𝗿𝘂𝗰𝘁𝘂𝗿𝗲
-> Cost of Revenues: $1.23B | +10.1% Q/Q | +26.7% Y/Y
-> Operating Expenses: $399M | -0.5% Q/Q | +38.1% Y/Y
-> S,G&A: $332M | flat Q/Q | +29.7% Y/Y
-> Interest Expense: $536M | +4.3% Q/Q | +27.6% Y/Y
-> Refinancing Costs: $27M
-> Amortization: $67M
𝗙𝗬𝟮𝟬𝟮𝟳 𝗢𝘂𝘁𝗹𝗼𝗼𝗸
-> Net Sales: $11.95B to $12.15B | ~14% growth at midpoint
-> Net Income: $2.44B to $2.49B | ~17% growth
-> GAAP EPS: $42.06 to $42.91 | ~20% growth
-> EBITDA As Defined: $6.20B to $6.35B | ~13% growth
-> EBITDA As Defined Margin: ~52%
-> Adjusted EPS: $47.09 to $47.94 | ~15% growth
𝗘𝗻𝗱-𝗠𝗮𝗿𝗸𝗲𝘁 𝗔𝘀𝘀𝘂𝗺𝗽𝘁𝗶𝗼𝗻𝘀
-> Commercial OEM: high-single-digit to low-double-digit revenue growth
-> Commercial aftermarket: high-single-digit growth
-> Defense: high-single-digit growth
𝗪𝗵𝗮𝘁 𝗖𝗵𝗮𝗻𝗴𝗲𝗱
-> Revenue increased 22.6% Y/Y
-> Gross profit increased 19.9% Y/Y
-> Operating income increased 17.5% Y/Y
-> EPS increased 33.3% Y/Y despite net income declining 3.9%
-> Interest expense increased 27.6% Y/Y
-> FY2027 outlook calls for ~14% sales growth and ~20% GAAP EPS growth at the midpoint
𝗕𝗼𝘁𝘁𝗼𝗺 𝗟𝗶𝗻𝗲
TransDigm continues to generate exceptionally high profitability, finishing Q4 with a 46% operating margin.
FY2027 guidance suggests the growth story continues, with management targeting roughly $12B of sales, more than $6.2B of EBITDA As Defined and another year of double-digit earnings growth.

$HRB Q1 FY2027 | Revenue +10% Y/Y, Seasonal Loss Widens as FY2027 Outlook Reaffirmed
H&R Block reported $224M of revenue, up 10.2% Y/Y, while higher cost of revenues and operating expenses resulted in a $232M operating loss and $188M net loss. Management reaffirmed its FY2027 revenue, EBITDA and adjusted EPS outlook.
𝗞𝗲𝘆 𝗡𝘂𝗺𝗯𝗲𝗿𝘀
-> Revenue: $224M | -80.4% Q/Q | +10.2% Y/Y
-> Gross Loss: $86M
-> Operating Loss: $232M
-> Pre-Tax Loss: $241M
-> Net Loss: $188M
-> Diluted EPS: -$1.53
-> Gross Margin: -38%
-> Operating Margin: -107%
-> Net Margin: -84%
𝗥𝗲𝘃𝗲𝗻𝘂𝗲 𝗠𝗶𝘅
-> Services: $213M | 95.2% of revenue | +11.1% Y/Y
-> Royalty, Product & Other: $11M | 4.8% of revenue | -5.2% Y/Y
𝗖𝗼𝘀𝘁 𝗦𝘁𝗿𝘂𝗰𝘁𝘂𝗿𝗲
-> Cost of Revenues: $310M | +13.2% Y/Y
-> S,G&A: $146M | +6.9% Y/Y
-> Interest Expense on Borrowings: $16M | +189.3% Y/Y
-> Other Income: $7M
-> Income Tax Benefit: $53M
𝗙𝗬𝟮𝟬𝟮𝟳 𝗢𝘂𝘁𝗹𝗼𝗼𝗸 𝗥𝗲𝗮𝗳𝗳𝗶𝗿𝗺𝗲𝗱
-> Revenue: $4.11B to $4.16B
-> Adjusted EBITDA: $1.11B to $1.14B
-> Adjusted diluted EPS: $6.04 to $6.24
-> Effective tax rate: ~23%
𝗖𝗮𝗽𝗶𝘁𝗮𝗹 𝗔𝗹𝗹𝗼𝗰𝗮𝘁𝗶𝗼𝗻
-> Quarterly dividend: $0.46 per share
-> Repurchased 2.2M shares for $100.3M during Q1
-> Average repurchase price: $45.68 per share
-> ~$500M remains under the $1.5B share repurchase authorization
-> $156.9M returned to shareholders YTD through dividends and buybacks
𝗪𝗵𝗮𝘁 𝗖𝗵𝗮𝗻𝗴𝗲𝗱
-> Revenue increased 10.2% Y/Y
-> Services revenue increased 11.1% Y/Y
-> Cost of revenues increased 13.2% Y/Y
-> Operating loss widened to $232M
-> Net loss reached $188M
-> FY2027 guidance was reaffirmed
-> H&R Block continued aggressive capital returns through dividends and share repurchases
𝗕𝗼𝘁𝘁𝗼𝗺 𝗟𝗶𝗻𝗲
H&R Block started FY2027 with double-digit revenue growth but remained loss-making in Q1 as costs exceeded the relatively small seasonal revenue base.
The bigger focus remains the full year, where management continues to expect $4.11B to $4.16B of revenue, $1.11B to $1.14B of adjusted EBITDA and $6.04 to $6.24 of adjusted diluted EPS, while continuing substantial shareholder returns.

6
278
$QUBT Q3 FY2026 | Revenue Surges 24x Y/Y, but Heavy Spending Keeps Losses Elevated
Quantum Computing reported $9.5M of revenue, up 2,374% Y/Y, as the business continued scaling from a small base. However, operating expenses remained far above revenue, resulting in a $28.6M operating loss.
𝗞𝗲𝘆 𝗡𝘂𝗺𝗯𝗲𝗿𝘀
-> Revenue: $9.5M | +71.1% Q/Q | +2,374.0% Y/Y
-> Gross Loss: $428K
-> Operating Loss: $28.6M
-> Pre-Tax Loss: $15.1M
-> Net Loss: $15.1M
-> Diluted EPS: -$0.07
-> Gross Margin: 5%
-> Operating Margin: -301%
-> Net Margin: -159%
𝗖𝗼𝘀𝘁 𝗦𝘁𝗿𝘂𝗰𝘁𝘂𝗿𝗲
-> Cost of Revenue: $9.1M | +35.1% Q/Q | +3,416.3% Y/Y
-> Operating Expenses: $29.0M | +32.8% Q/Q | +175.5% Y/Y
-> G&A: $15.4M | +34.2% Q/Q | +194.5% Y/Y
-> R&D: $8.3M | -1.1% Q/Q | +84.9% Y/Y
-> S&M: $5.3M | +172.4% Q/Q | +568.7% Y/Y
𝗡𝗼𝗻-𝗢𝗽𝗲𝗿𝗮𝘁𝗶𝗻𝗴 𝗜𝘁𝗲𝗺𝘀
-> Interest & Other Income: $13.0M
-> Change in Fair Value of Derivative Liability: -$458K
-> Interest Expense: $65K
𝗪𝗵𝗮𝘁 𝗖𝗵𝗮𝗻𝗴𝗲𝗱
-> Revenue increased more than 24x Y/Y
-> Cost of revenue increased faster than revenue
-> Operating expenses increased 175.5% Y/Y
-> G&A nearly tripled Y/Y
-> S&M increased more than 6x Y/Y
-> Operating loss reached $28.6M
-> $13.0M of interest and other income materially reduced the pre-tax loss
-> Net loss finished at $15.1M
𝗕𝗼𝘁𝘁𝗼𝗺 𝗟𝗶𝗻𝗲
QUBT is showing explosive top-line growth, but the scale is still small relative to its expense base.
The key number beneath the headline growth is operating leverage: $9.5M of revenue versus $29.0M of operating expenses produced a $28.6M operating loss. Non-operating income helped narrow the final net loss to $15.1M.

$OXY Q3 FY2026 | Revenue Flat Y/Y as Earnings Improve Sharply
Occidental reported $6.77B of revenue, roughly flat Y/Y, while operating income, pre-tax income and net income increased sharply from last year despite a weaker Q/Q comparison.
𝗞𝗲𝘆 𝗡𝘂𝗺𝗯𝗲𝗿𝘀
-> Revenue: $6.77B | -18.7% Q/Q | +0.8% Y/Y
-> Gross Profit: $3.15B | -35.8% Q/Q | +39.6% Y/Y
-> Operating Income: $2.14B | -45.1% Q/Q | +68.6% Y/Y
-> Pre-Tax Income: $2.40B | -38.8% Q/Q | +105.4% Y/Y
-> Net Income: $1.64B | -41.7% Q/Q | +147.7% Y/Y
-> Diluted EPS: $1.61 | -41.5% Q/Q | +147.7% Y/Y
-> Gross Margin: 48%
-> Operating Margin: 36%
-> Net Margin: 28%
𝗥𝗲𝘃𝗲𝗻𝘂𝗲 𝗠𝗶𝘅
-> Oil & Gas: $6.44B | 98.0% of pre-elimination revenue | -6.5% Q/Q | +28.5% Y/Y
-> Midstream & Marketing: $262M | 4.0% | -80.2% Q/Q | -32.8% Y/Y
-> Eliminations: $133M
-> Interest, Dividends & Other Income: $171M
𝗖𝗼𝘀𝘁 𝗦𝘁𝗿𝘂𝗰𝘁𝘂𝗿𝗲
-> Cost of Revenue: $3.42B | -0.2% Q/Q | -23.4% Y/Y
-> Operating Expenses: $1.01B | +0.1% Q/Q | +2.4% Y/Y
-> D&A: $1.78B | -3.5% Q/Q | -13.5% Y/Y
-> Oil & Gas Expense: $1.19B | +6.7% Q/Q | +1.5% Y/Y
-> Transportation & Gathering: $445M | -3.9% Q/Q | +7.0% Y/Y
-> S,G&A: $224M | -14.5% Q/Q | -19.1% Y/Y
𝗪𝗵𝗮𝘁 𝗖𝗵𝗮𝗻𝗴𝗲𝗱
-> Revenue increased just 0.8% Y/Y
-> Cost of revenue declined 23.4% Y/Y
-> Gross profit increased 39.6% Y/Y
-> Operating income increased 68.6% Y/Y
-> Pre-tax income more than doubled Y/Y
-> Net income increased 147.7% Y/Y
-> EPS increased 147.7% Y/Y
-> Midstream & Marketing revenue declined sharply both Q/Q and Y/Y
𝗕𝗼𝘁𝘁𝗼𝗺 𝗟𝗶𝗻𝗲
Occidental’s top line was essentially flat Y/Y, but the earnings profile improved substantially as lower cost of revenue helped drive stronger gross and operating profitability.
Net income reached $1.64B and EPS reached $1.61, both up nearly 148% Y/Y, although most major earnings measures declined meaningfully from the prior quarter.
