

All our posts are purely educational, not buy or sell recommendations! https://xitter.gq/t.co/NF8WNPOmpV
Joined August 2023
- Tweets2K
- Following14
- Followers1.7K
- Likes10





Pinned Tweet
Weekly US Indices Probability Map: Nov 09-13, 2026, #optionstrading #stockmarket #tradingstrategy #dowjones #SPX500 #nasdaq $QQQ $SPY
We may witness a relief rally!!


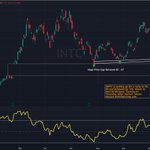
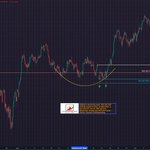
$INTC is setting up for a rally to 95, 99 followed by 105. Needs to hold 82-80 base. Earning on Thursday after market. Daily charts looks constructive, daily RSI is showing initial signs of oversold conditions.

$SPY interesting pattern during mid-term election October - December. Republican vs Democrats!

Weekly US Indices Probability Map: Oct 26 - 30, 2026, #optionstrading #stockmarket #tradingstrategy #dowjones #SPX500 #nasdaq $QQQ $SPY
Next week is the busiest of the reporting season!


$QQQ: Hold 700–703.50 base, then 709.30–710 is in play. Lose support, and 694–695 comes into focus. — @twtlearning

$TSLA: Hold $340, and $395 is in play; a breakout targets $428–$435. Lose $340, and $305–$310 comes into focus. Earnings preview 👉investing.com/analysis/tesla…

$NFLX: Holding $66.50–$69.25 keeps $75–$82 in play; a break below $66.50 puts $60 in focus.
$NFLX earnings preview: 👉investing.com/analysis/netfl…

$QQQ may continue to grind higher into the midterm elections. The path may not be smooth, but the trend remains constructive. — Senior Analyst @twtlearning

Weekly US Indices Probability Map: Oct 19 - 23, 2026, #optionstrading #stockmarket #tradingstrategy #dowjones #SPX500 #nasdaq $QQQ $SPY
AI Trade to Test Rally as Meta Earnings Loom!


Weekly US Indices Probability Map: Oct 05 - 09, 2026, #optionstrading #stockmarket #tradingstrategy #dowjones #SPX500 #nasdaq $QQQ $SPY
S&P 500 earnings are expected to surge more than 30% in Q3, building on a strong first half, according to LSEG IBES.


Weekly US Indices Probability Map: Oct 05 - 09, 2026, #optionstrading #stockmarket #tradingstrategy #dowjones #SPX500 #nasdaq $QQQ $SPY
Since 1945, the S&P 500 has risen in 85% of Q4s, averaging a 4.2% gain, as per CFRA research.
