

Elliot Wave Analyst Click the link for access to more of my analysis
Joined July 2020
- Tweets9.4K
- Following105
- Followers22.7K
- Likes5.5K




Pinned Tweet
$SPY Peaked at 781.62 as of this time.
$1.62 above my target given 6 months ago for this primary wave 3.
With $SPY now below the 50D EMA for the second consecutive session. The risk grows as buyers struggle to regain momentum.
With each passing day we build below the 50D EMA.
The more likely it is that continuation down into the 200D EMA can and will follow next.
I remain confident that this is just the start to primary wave 4(red circle 4) as we venture back to $683, $619-$629, $600.


$SPY Weekly 🎯745 | 766 | 780
• Extended wave 1 = shorter wave 3. As long as wave 5 peak is < $850 this count works.
• I Initially had Feb 25' as wave 3 high but that's a bit short for standard wave 3's.. I've pushed that out to 750-780 range
• Internal wave 3 count(blue) looks like a diagonal but measures as an impulse
*This does not imply a vertical ascent... the line to wave 5 of 3 is associated to the label by TV default*

$SPY 19% of the stocks above the 50D Moving Average in the S&P have now lost the 50D Moving average.
We still have 57% of the S&P above the 50D Moving Average.
That number can fade to < 30% before we sniff oversold conditions.
Extremely oversold conditions is <= 15%
As mentioned last week for expansion scenarios...
50D EMA is the upside ceiling to break.
200D EMA is the floor to break
200D EMA stick save after hours this time but there is still room for weakness looking at overall participation

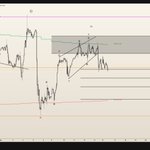
$SPY Multi-month wedge breakdown last week.
200D EMA supportive while 50D EMA acting as resistance.
Weekly Inside Bar to end this week as well after a bearish engulfing candle.
Its quite clear where the weekly pivots are at.
Big move loading while, 70% of all holdings above the 50D Moving Average in the S&P.
$NVDA earnings right around the corner.

2
19
3,227

all these accounts promised bottom last week.
all these accounts with 30k, 50k, 100k+ followers.
Shame.
5
40
3,440
$SPY while they all called bottom..
"Personally, I struggle to be bullish as a trader below the 50D EMA. Remain below 750 and I see downside back into 735."

$SPY Last update I was looking for a pull back off the 50D EMA
Ultimately this is what happened but since the last update.. things have changed a bit structurally.
The rally off the lows was 5 waves up on the 11th.. Then the 12th the market made a new high since NOV lows..
marking 6 waves up. This means 1 of 2 things.
1) WXY up which means that entire rally was corrective and downside acceleration will presume.
2) This dip is a wave 4 of 5 for the first impulsive off the lows and buyers HAVE to defend 745/748.
Personally, I struggle to be bullish as a trader below the 50D EMA. Remain below 750 and I see downside back into 735.
I haven't traded rally on $SPY perfectly with short term positions unfortunately but I do still hold my 2027 $SPY puts at this time as I see downside continuation still being on the table.
Best of luck this week everyone.


$SPY I posted the first chart back in May of this year.
Second chart is the updated version.


$SPY Weekly 745 🎯 is approaching
Anything beyond is a gift for this phase.
I'll be planning for a high to develop between 742-781 so there is a bit more room to run still.
Keep in mind distribution at the highs typically take some time (weeks and even a couple of months)
Wave 4 (red) fibs are subject to change based on where the exact high is but.. assuming its 745.
652 and 594.50 would be the measured downside targets.
This either take place as a flat structure or a double zig zag in my opinion.
Wave 5(red) aims for 880 & 900 to complete this cycle since Covid Lows.


$SPY Longer we stay below 750..
the more likely it is the 200D EMA gets tested again.
Lose the 200D EMA & its night night

$SPY Peaked at 781.62 as of this time.
$1.62 above my target given 6 months ago for this primary wave 3.
With $SPY now below the 50D EMA for the second consecutive session. The risk grows as buyers struggle to regain momentum.
With each passing day we build below the 50D EMA.
The more likely it is that continuation down into the 200D EMA can and will follow next.
I remain confident that this is just the start to primary wave 4(red circle 4) as we venture back to $683, $619-$629, $600.
$SPY Last update I was looking for a pull back off the 50D EMA
Ultimately this is what happened but since the last update.. things have changed a bit structurally.
The rally off the lows was 5 waves up on the 11th.. Then the 12th the market made a new high since NOV lows..
marking 6 waves up. This means 1 of 2 things.
1) WXY up which means that entire rally was corrective and downside acceleration will presume.
2) This dip is a wave 4 of 5 for the first impulsive off the lows and buyers HAVE to defend 745/748.
Personally, I struggle to be bullish as a trader below the 50D EMA. Remain below 750 and I see downside back into 735.
I haven't traded rally on $SPY perfectly with short term positions unfortunately but I do still hold my 2027 $SPY puts at this time as I see downside continuation still being on the table.
Best of luck this week everyone.
$SPY Clear impulse off the lows currently.
Often times than not.. an impulse off the lows leads to continuation higher. Whether that be a wave 3 or C is up for interpretation.
Continued corrective case: This was an X of WXY but we'd need to see downside sub $740 to have increased confidence in that with confirmation below 733.50
For now.. I expect a mean reversion back towards $750, $744 next so as long as the 50D EMA acts as resistance here near 761.

$BTC We've been talking about a wave 2 for over a month now.. even the possibility of it being a flat/shallow wave 2
What we have today is not what I expected. This is quite deep for a wave 2.
Technical an impulse remains valid above W1 Lows (57.9k), however..
If buyers can't defend 64.1k. My confidence in this bullish structure (HTF ChoCH and impulsive structure) will drop incredibly low.
Its not a good look for Bitcoin right now and a rebid of 69.7k would be a positive sign if buyers can manage.

$BTC The accuracy remains unmatched.
I warned Sept 21st that a W2 correction will follow in the coming weeks.
We are now seeing that correction take place.
There are two options.
1) This correction remains shallow and price will briefly lose the 50W EMA before reclaiming and building out a base for wave 3
Same scenario as 2023
2) A steep correction which is common for wave 2's and we get a fade back into 72,600 as they sweep September lows for liquidity before beginning the next wave higher.
For now, those with patience will be rewarded because this will likely take several weeks (few months) to develop

$SPY Multi-month wedge breakdown last week.
200D EMA supportive while 50D EMA acting as resistance.
Weekly Inside Bar to end this week as well after a bearish engulfing candle.
Its quite clear where the weekly pivots are at.
Big move loading while, 70% of all holdings above the 50D Moving Average in the S&P.
$NVDA earnings right around the corner.
$SPY Peaked at 781.62 as of this time.
$1.62 above my target given 6 months ago for this primary wave 3.
With $SPY now below the 50D EMA for the second consecutive session. The risk grows as buyers struggle to regain momentum.
With each passing day we build below the 50D EMA.
The more likely it is that continuation down into the 200D EMA can and will follow next.
I remain confident that this is just the start to primary wave 4(red circle 4) as we venture back to $683, $619-$629, $600.
$NVDA Already up $12 from the buy spot. Pure Precision.
Close above 164 and you can put it at 188.
Thanks for playing


$NVDA I posted this all time count 5 months ago and was the EW theorist to do so while many only counted from 2020 or beyond.
I warned about this monthly rising wedge. It was painfully obvious.
Very few wanted to consider it.. actually most wanted to tell me im wrong.
we now have a sweep of the 164 equal lows as the 2025 breakout spot gets re-tested..
A reversal in the 141.50-153 range is what I'll be watching for to get a rally back into 189-200. Confirms on a close above 164...
If it gets ugly, monthly demand at 86-115 is my value buy im keeping in mind given the all time count suggests this is a clear cyclical reversal


5
56
7,679

$NBIS Still no wave 4. Probably get a rally on ER and then more downside into $60-$80
Side story for those of you who share your knowledge for free:
Remember guys. fintwit wants you to stay wrong and to be a bag holder, see comments on quoted tweet
Prior to AUG ER, I saw $100 on the charts.
Then AUG ER produced a face ripper and I said "it'll probably hit $300 now"
New data presented itself over 2 months. That information said clearly this is going to $100. I warned of this at $220.
1 Month later. that was the case.
Its okay to be wrong, its not okay to stay wrong. Fuck the haters on here, they are in abundance.
Cheers if you shorted or protected yourself.

$NVDA I posted this all time count 5 months ago and was the EW theorist to do so while many only counted from 2020 or beyond.
I warned about this monthly rising wedge. It was painfully obvious.
Very few wanted to consider it.. actually most wanted to tell me im wrong.
we now have a sweep of the 164 equal lows as the 2025 breakout spot gets re-tested..
A reversal in the 141.50-153 range is what I'll be watching for to get a rally back into 189-200. Confirms on a close above 164...
If it gets ugly, monthly demand at 86-115 is my value buy im keeping in mind given the all time count suggests this is a clear cyclical reversal
$NVDA
Weekly demand at 164-181..
Lose 164 though and this comes back into monthly demand at 123 which is kind of what I anticipate given when wedges break.
The best support is the start of the wedge


$SPY Clear impulse off the lows currently.
Often times than not.. an impulse off the lows leads to continuation higher. Whether that be a wave 3 or C is up for interpretation.
Continued corrective case: This was an X of WXY but we'd need to see downside sub $740 to have increased confidence in that with confirmation below 733.50
For now.. I expect a mean reversion back towards $750, $744 next so as long as the 50D EMA acts as resistance here near 761.
$SPY So far just a false breakout above 750 to trap longs once again..
Would like to see this confirm below 744-745 next as that invalidates the most likely impulse scenario for bulls.
That should open the door into 733.50 rather swiftly from there.
A close above 750 going forward puts the continued selling case in jeopardy of invalidating


$SPY So far just a false breakout above 750 to trap longs once again..
Would like to see this confirm below 744-745 next as that invalidates the most likely impulse scenario for bulls.
That should open the door into 733.50 rather swiftly from there.
A close above 750 going forward puts the continued selling case in jeopardy of invalidating
$SPY If there is going to be continuation down to complete an impulse.
It has to begin here.
$750 has been a critical pivot since Sept (market monthly lows then).
It also game into play on election night just a week ago.
Sellers hold here... The 200D EMA trades next with potential sweep the june lows to complete a 5 wave move down.
Above 750 & the sell case loses favorable probability.
Im still holding my 2027 $SPY puts


$SPY If there is going to be continuation down to complete an impulse.
It has to begin here.
$750 has been a critical pivot since Sept (market monthly lows then).
It also game into play on election night just a week ago.
Sellers hold here... The 200D EMA trades next with potential sweep the june lows to complete a 5 wave move down.
Above 750 & the sell case loses favorable probability.
Im still holding my 2027 $SPY puts
$SPY Peaked at 781.62 as of this time.
$1.62 above my target given 6 months ago for this primary wave 3.
With $SPY now below the 50D EMA for the second consecutive session. The risk grows as buyers struggle to regain momentum.
With each passing day we build below the 50D EMA.
The more likely it is that continuation down into the 200D EMA can and will follow next.
I remain confident that this is just the start to primary wave 4(red circle 4) as we venture back to $683, $619-$629, $600.
$SPY Pray for a gap up tonight
It'll be the easiest short you can ask for.
That 716 wick from June should get filled
measured downside into 720, 715, 706 is on the table.

$SPY Peaked at 781.62 as of this time.
$1.62 above my target given 6 months ago for this primary wave 3.
With $SPY now below the 50D EMA for the second consecutive session. The risk grows as buyers struggle to regain momentum.
With each passing day we build below the 50D EMA.
The more likely it is that continuation down into the 200D EMA can and will follow next.
I remain confident that this is just the start to primary wave 4(red circle 4) as we venture back to $683, $619-$629, $600.
Avery retweeted
$SPY I need you guys to understand something right now..
71% of the S&P 500 was above the 50D MA yesterday.
SEVENTY ONE.
nearly 50% of the S&P can lose the 50D MA before we hit oversold territory.
We are on floor 70 out of 100.
Oh and this played out nearly exactly how I said it should.
history doesn't repeat but it often rhymes

thought this was interesting..
1) Q4 of 2021. $SPY was stuck in range for 7 weeks while in a rising wedge structure.
2) November 29th, Stocks above the 50D EMA flashed oversold warnings for savvy dip buyers.
3) January 3rd, 35 days later. Stocks above the 50D EMA ramped into near overbought territory as SPY made a new all time high to complete the rising wedge.
4) correction began next.
Growth darlings sold off first.. leaders faded last
Fast forward to now...
1) Q3 of 2026. $SPY has been stuck in range for 7 weeks while in a rising wedge structure.
2) September 14th, stocks above the 50D EMA flashed oversold warnings for savvy dip buyers.
Steps 1 and 2?✅
My bet is that Step 3 follows. Step 4? TBD but rising wedges often lead to reversals after completion.
a move into all times high just 35 days later which is Oct 19th. Just after OPEX which often is a window of weakness.
A-lot of growth darlings have been slaughtered over the last 4 months while the leaders kept pressing on.
Just like in the late stage rally of 2021.
There are a-lot of similarities here.. History doesn't always repeat but it often to rhymes is all im saying.
Best of luck as always

