

Creator of Elliott Wave 2.0 | Free + Premium Discord in Bio W4/W5 Model now free on TradingView.
1.618
Joined May 2014
- Tweets4K
- Following98
- Followers99.5K
- Likes11.2K





Pinned Tweet
$SPX ROAD TO 10,000.
Short term: a pullback.
Big picture: still headed to 10,000.
Two paths:
1. A shallow dip to ~7,400–7,300, then the final push higher.
2. The move from 2022 is done, and a deeper drop to ~7,000 comes first.
Either way, the destination is the same.


Were you surprised by today’s $SPX crash?
Our members weren’t.
At 9:55 AM I warned them that a 3rd wave decline could be in progress, with an A = C target at 7,400–7,440.
Hours later, price sliced right through it and closed at 7,353.
EW 2.0 prepares you for historic days like today, and nothing else comes close.

10,000 is coming.
The pullback I called for is here, and it was part of both paths.
Now the question is which one plays out:
Path 1: the bottom is in or close, and we head higher from here.
Path 2: a deeper correction first, then 10,000.
I’m leaning Path 1.
Which one are you betting on?
$SPX ROAD TO 10,000.
Short term: a pullback.
Big picture: still headed to 10,000.
Two paths:
1. A shallow dip to ~7,400–7,300, then the final push higher.
2. The move from 2022 is done, and a deeper drop to ~7,000 comes first.
Either way, the destination is the same.
I called the TOP on $SPX.
It's down 450 (!) points since my call.
Next I'll call the BOTTOM, and it's getting close.
Most people will catch the bottom call too late.
Just like the top...
$SPX: A FIVE WAVE ADVANCE FROM THE 2022 LOW.
Waves 1 through 4 are COMPLETE.
Wave 5 is taking the shape of an ENDING DIAGONAL.
Ending diagonals retrace the whole pattern QUICKLY.
→ 7,200.


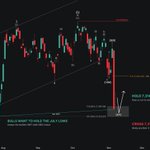
$SPX MAJOR BOTTOM SOON
After today’s massive decline, we could be getting close to a multi-month bottom.
But the bottom is NOT in on this candle.
My main lean is one more push lower to TEST the July lows at 7,314.
Bulls want to HOLD the July lows to keep the bullish SMT with $NDX intact, but I’m expecting at least today’s low to get crossed.
If July lows gets crossed, the SMT is invalid and the next bounce could be a bearish W4.
The strength of the recovery from there will be telling.
While price is below the momentum break of this potential wave 3 at 7,533, bears are in control.
Above it, we get a bullish WXY to new highs.
Tomorrow I’ll share a potential daily buy signal if the setup presents itself.

Were you surprised by today’s $SPX crash?
Our members weren’t.
At 9:55 AM I warned them that a 3rd wave decline could be in progress, with an A = C target at 7,400–7,440.
Hours later, price sliced right through it and closed at 7,353.
EW 2.0 prepares you for historic days like today, and nothing else comes close.
TRIGGER TRADES retweeted

🐐@TriggerTrades is one of the best in this business! Study 📚 his model I have for the last 5yrs. 💫
🚨 WARNING WAS SENT
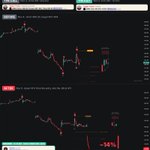
Last night I said $NDX was the cleaner bear count, with one more leg lower to finish wave 5.
Today it delivered, and members cashed out MASSIVE GAINS on $QQQ puts.
One member who only joined last night made a MONTH OF SALARY.
And another member said it’s “by far the best service” he’s ever subscribed to.

🚨 WARNING WAS SENT
Last night I said $NDX was the cleaner bear count, with one more leg lower to finish wave 5.
Today it delivered, and members cashed out MASSIVE GAINS on $QQQ puts.
One member who only joined last night made a MONTH OF SALARY.
And another member said it’s “by far the best service” he’s ever subscribed to.
$NDX is the cleaner bear count.
Its W4/W5 structure is still intact
As long as price stays below today’s high, I’m leaning toward one more leg lower to finish wave 5.
Here’s the scenario I’m watching: NDX makes a lower low to complete its fifth wave while SPX holds a higher low.
That’s a bullish SMT between the two, and it could be what sends SPX up to that 7,725 trendline.

The ABC Model works on EVERYTHING.
Shorted $AMD yesterday at 480.20, targeting 457–444.
Price blew straight through the target, dropping 14% (!)
I took profits at 441.05 for +8.15%, and one of our members sold for +$2K off the same setup.

$NQ slaughtered AGAIN by the ABC Model.
At 8:56 AM I projected a flush lower off B.
By 10:26 AM, price had crushed 1,300 points straight into the 1.618 extension.
This is FUN.

TRIGGER TRADES retweeted
$NDX is the cleaner bear count.
Its W4/W5 structure is still intact
As long as price stays below today’s high, I’m leaning toward one more leg lower to finish wave 5.
Here’s the scenario I’m watching: NDX makes a lower low to complete its fifth wave while SPX holds a higher low.
That’s a bullish SMT between the two, and it could be what sends SPX up to that 7,725 trendline.
$SPX CORRECTIVE RALLY
After the overnight volatility, SPX is now in a corrective rally.
I’m expecting a pullback tomorrow that erases about half of that rally.
The target is the 0–B trendline near 7,725.
That’s the main draw before the next push lower.
I’d expect that dip to get bought on the way up to that line.

$NQ slaughtered AGAIN by the ABC Model.
At 8:56 AM I projected a flush lower off B.
By 10:26 AM, price had crushed 1,300 points straight into the 1.618 extension.
This is FUN.
The ABC Model nailed all 3 major $NQ moves the last 2 days. Crazy.
Look at the reaction off the 90-100% extensions, the most common fib targets.
This is NOT random.
Why? The market moves in 3s and LOVES common fibs.
ABC is the RHYTHM of the market and the most common pattern there is.
This is why I’m ALL IN on Elliott Wave, so all in I had to build an even BETTER version:
EW 2.0.
The ABC Model is the core model.
It filters strong reversals from bad ones with higher timeframe alignment, to get you on the right side, or at least keep you off the wrong one.

Members caught this 1,300-point flush in REAL TIME while everyone else was watching it happen.
Don’t watch the next one from the sidelines too.
Join the Elliott Wave 2.0 Mentorship for the ABC Model, all of my indicators and the Discord.
🔗 whop.com/checkout/plan_YMNFu…

$NDX is the cleaner bear count.
Its W4/W5 structure is still intact
As long as price stays below today’s high, I’m leaning toward one more leg lower to finish wave 5.
Here’s the scenario I’m watching: NDX makes a lower low to complete its fifth wave while SPX holds a higher low.
That’s a bullish SMT between the two, and it could be what sends SPX up to that 7,725 trendline.
$SPX CORRECTIVE RALLY
After the overnight volatility, SPX is now in a corrective rally.
I’m expecting a pullback tomorrow that erases about half of that rally.
The target is the 0–B trendline near 7,725.
That’s the main draw before the next push lower.
I’d expect that dip to get bought on the way up to that line.
The indicator I’m using for this is actually free on TradingView tradingview.com/script/CMlXb…

$SPX CORRECTIVE RALLY
After the overnight volatility, SPX is now in a corrective rally.
I’m expecting a pullback tomorrow that erases about half of that rally.
The target is the 0–B trendline near 7,725.
That’s the main draw before the next push lower.
I’d expect that dip to get bought on the way up to that line.
$ES dropped -143, then ripped +200.
It’s an overnight game now
My first prop firm partner: @VestExchange.
Hold overnight AND weekends, static drawdown.
Been waiting for a firm like this FOREVER.
An EWC member took an 8 AM long +$500.
Use code EWC 🔗 next.vestmarkets.com/r/ewc

This type of wave counting is INSANE to me.
Traders keep OVERCOMPLICATING Elliott Wave.
This $BTC chart is the most simple structure there is...
a 5-3-5 ABC down.
Notice 3 things on my count:
- Both 4th waves are smaller than their 2nd waves.
- (B) is the dominant correction of the trend.
- (C) ended at a common fib target, near equal with (A).
That’s what you’re going for: the count with the most common tendencies.
The labeling below is the overcomplication I’m talking about.
You can’t teach it, and that’s NOT a good thing. It means it’s too subjective.
EW 2.0 is mechanical.
Find the 4ths, compare them to the 2nds, and make sure they’re smaller.
This is why Elliott Wave gets a bad rep, and exactly what I’m fixing with EW 2.0.
It’s much easier to explain and, more importantly, easier to repeat.


