

Let's turn complex information into powerful visuals // #dataviz // #infographics // #informationdesign // #workshops // since 2014 // by @Koen_VdE
- Tweets767
- Following233
- Followers646
- Likes265




ALT Infographic titled "Team effort" about the Nobel Prize in Physics. A bar chart shows the number of laureates per year from 1901 to 2026, on a scale from 1 to 3. In the early decades most years have one laureate, with occasional years of two or three. From around the 1950s onward, years with two and three laureates become increasingly common, and a note says the prize has been awarded more and more often to groups of researchers rather than individuals. Two single-laureate years are highlighted in dark brown and labeled with portraits: Georges Charpak in 1992 and Francis Halzen in 2026. The text explains that Halzen's 2026 prize to a single person is unusual, as the last time this happened was 34 years earlier.

ALT Infographic titled "Ocean Pollution" from worldoceannetwork.org, presenting key statistics about marine pollution across three visual layers representing the ocean surface, water column, and seabed. Surface level highlights four facts: poisonous algal species have increased threefold; 1 in 20 adults will become ill after a single exposure to contaminated water; cigarettes are the most collected item during beach clean-ups; and 15% of our annual food intake consists of microplastics. Mid-water level shows three statistics illustrated with silhouettes of marine animals: 267 marine species are prone to ingesting plastic debris (illustrated with a sea turtle); 55% of the fish we eat have ingested plastic (illustrated with fish among plastic bags); and 100,000 marine creatures die per year from plastic entanglement (illustrated with a seal tangled in debris). Two additional facts are noted: 70% of litter sinks to the seabed, and the average lifespan of a plastic bag is just 12 minutes.

ALT A collection of different visuals shown in the Coolors Visualizer tool, where you can see the same color palette being used in different illustrations, typography, and a dashboard.

ALT A “Before and After” comparison of a research structure diagram. Before: A dense yellow-orange block diagram with boxes and sub-boxes showing sections such as “Introduction and Motivation,” “The Concept of Uncertainty,” and “Uncertainty Representation Approaches,” Subtopics like “Data Sampling Uncertainty,” and “Decision Uncertainty” are clustered, making the layout busy and visually cluttered. After: A clean, vertical flow diagram resembling a timeline or hierarchy, numbered 1–5. Each main section branches into smaller indented topics with light connecting lines. A gray line runs through the sequence toward “Conclusion.” New elements are marked with an exclamation symbol. The redesign replaces the crowded box layout with an elegant, linear structure that clarifies relationships and sequence.


ALT Book cover for the book 'A history of data visualization & graphic comunication' by Michael Friendly and Howard Wainer. The book shows the title of the book in white text on a black background, with below that a series of narrow blue area charts.

ALT Two charts illustrate the “duck curve” for Belgium in August 2025. The top chart shows electricity demand over 24 hours. A dark blue line represents the total load, peaking around midday and again in the evening. A lighter turquoise line shows the load without solar generation, dipping sharply between 10:00 and 16:00, creating a “belly” shape. An annotation highlights the steep evening ramp — the problematic region where demand on non-solar sources rises quickly. A faint duck silhouette in the background emphasizes the curve’s shape. The bottom chart shows estimated solar production, a bell-shaped orange curve peaking at midday around 4 GW and dropping back to zero at sunrise and sunset. Data source: Elia Transmission Belgium SA.

ALT Two pages from the most recent VIB annual report. The left page shows a circular Voronoi chart indicating the regional, European, and global impact of the institute. The page on the right shows the economic impact using an area chart, growing from 548 million euros in 2013 to 994 million in 2023.

ALT Mockup showing two pages of the data visualization checklist. Some categories are visible: text, arrangement, and lines. Each category has a few guidelines with a description and rating options of 0, 1, or 2.

ALT A clustered bar chart titled 'How generative AI impacts our jobs' showing 17 job types. It compares technical automation potential with & without AI.

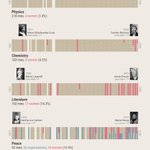
ALT An infographic showing a timeline for each of the six Nobel Prize categories, between 1901 and 2024. For each category, the female winners have been highlighted. The bottom of the infographic shows a bar chart plotting the number of male versus female laureates over time.


ALT Book cover for Daphne Draws Data: A storytelling with data adventure, a children's book by Cole Nussbaumer Knaflic and illustrated by John Skewes. The cover shows a cute red bright pink dragon with blue wings, holding a crayon.
