

The Boom Bust Signal Measure Of Risk Asymmetry By David Brown
East Hampton, NY
Joined October 2020
- Tweets1K
- Following0
- Followers3.4K
- Likes167





Everyone's a genius in a bull market.
Until the crowd turns.
Greed drags prices too high. Fear drags them too low.
BOOM = overbought. BUST = oversold.
The herd never knows which one it's in.
Do you?
Subscribe → theboombust.com/sps

Learn the differences between our signals offered by TheBoomBust;
📊 Algo: medium to long term
🎯 Strategic: fundamental opportunities
⚡ Short term: daily signals
🔄 Rotation: relative sector strength
Explore → theboombust.com

Four Colors. One Decision.
🟥 Strongly overbought
🟧 Becoming overbought
🟦 Becoming oversold
🟩 Strongly oversold
Roubini's macro read on every signal.
Up to 85% accurate on strong signals.*
*Back-tested, historical, not guarantees.
Subscribe → theboombust.com/sps

Stocks, Gold and the Dollar
Find out about twenty years of index returns that put currency and ounces of gold side by side.
NEW file available at: theboombust.com/menu


New Macro File Available.
S&P Illusion, Gold Exposes losses
theboombust.com/menu

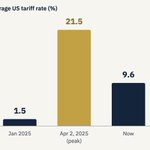
Tariffs hit 21.5%. Oil topped $100. A war broke out with Iran.
The global economy should have cracked. It didn't.
@Nouriel says one factor matters more than all the others, and it's not the one you'd guess.
Find out what factor this is @ theboombust.com in our macro files section.

Inflation fell in 2025.
Then 2026 happened.
Where it goes in 2027 depends on a dilemma every central bank is stuck in. @Nouriel walks through it in his new piece.
Subscribe to The Boom Bust to read it ↓
theboombust.com/macrofiles

Nouriel Roubini, the man nicknamed "Dr. Doom" (is now bull-ish) just made the case for a benign 2027.
But he also lays out the 5 things that could blow it up.
Which risk worries you most? 👇
theboombust.com/macrofiles
My New Theory: Does the Earth’s Rotation Influence Where Humans Settle?
Here’s a theory I’ve been thinking about.
The Earth does not move at the same linear speed everywhere. At the equator, its surface is rotating at roughly 1,670 km/h, while that speed progressively decreases as you move toward the poles, reaching essentially zero at the geographic poles.
Could this have influenced human settlement over thousands of years?
My theory is that the greater rotational movement closer to the equator may have had subtle effects on physical balance, human behavior, adaptation, and ultimately where populations preferred to settle. As you move farther from the equator, the rotational speed decreases, potentially creating an environment that—however subtly—favored greater physical equilibrium.
Think of an ant on a spinning disk: would it naturally prefer to remain near the center, where its linear speed is lower, or toward the outer edge, where the movement is greatest?
Perhaps something similar, on an enormously larger and far more subtle scale, has played a role in human geography.
I’m not presenting this as established science—it’s a hypothesis. But sometimes an interesting question begins by looking at something familiar from a completely different angle:
Could the rotation of the Earth have influenced where human civilization chose to settle and develop?
David Brown
Roubini on The Global Economy
theboombust.com/menu
Select Files once you open the Website


I've spent the last few months making explainer content for The Boom Bust Signal. The idea that stuck with me most is simple:
The hardest time to sell is when everyone's euphoric. The hardest time to buy is when everyone's panicking.
That's exactly when the signal fires.
A Red Boom tells you the crowd has piled in and it may be time to take profit. A Green Bust tells you the crowd has fled and value may be sitting there.
It takes the emotion out of the two decisions most investors get wrong.
If you've ever sold at the bottom or bought at the top (most of us have), subscribe here → theboombust.com/plans-pricin…

Two numbers behind the Boom Bust Signal:
20 years of back-testing
Up to 85% historical accuracy on strong signals
It has been tested across two decades of booms, busts, crashes and recoveries in stocks, bonds, currencies and gold.
It won't be right every time, and no honest signal claims to be. It's built to put the odds on your side when markets reach extremes.
Subscribe here → theboombust.com/
A number tells you what is happening. It doesn't tell you why.
Every Boom Bust Signal comes with Nouriel Roubini's read on the economic and political forces behind the move.
So you get two things:
→ A quantitative signal showing when a market is overbought or oversold
→ The macro context explaining what's driving it
It pairs data with judgment, across 9 major markets.
Subscribe here → theboombust.com/plans-pricin…
Most market research hands you 40 pages and no conclusion.
The Boom Bust Signal gives you one colour:
🔴 RED BOOM: strongly overbought. Take profit or reduce.
🟠 ORANGE BOOM: heating up. Watch closely.
🔵 BLUE BUST: value starting to appear. Get ready to buy.
🟢 GREEN BUST: strongly oversold. Buy or increase.
The strong signals (Red and Green) have a 70–85% historical probability of a 10–20% move.
Four colours. One decision.
Subscribe here → theboombust.com/plans-pricin…