

Graphics editor @TorontoStar. Dataviz, design, code, etc.
Toronto
Joined June 2009
- Tweets450
- Following428
- Followers409
- Likes270




Cameron Tulk retweeted

Boggles my mind how often people on this website reply to my tweets with a map ripped from the Highway 413 investigation, as if to bring it to my attention
Like... yes? I know? That's literally from a story my name is on?
Cameron Tulk retweeted

We're hiring a data viz journalist to join the Americas graphics team at Reuters!!!
I'll be the manager for the role, but am going on maternity leave June 10. Until then, I would love speak to interested candidates, answer any questions, etc.
jobs.thomsonreuters.com/job/…


Cameron Tulk retweeted

How safe is it for schools to reopen?
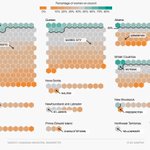
@kellygrant1 and @hichenwang did a deep dive into neighbourhood-level COVID-19 data across 5 Canadian cities, and they found things are looking pretty good -- but there are a few hot spots and warning signs.
theglobeandmail.com/canada/a…

Cameron Tulk retweeted

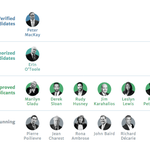
Erin O'Toole pitched himself as the Conservative leader who can win in Ontario. The data says he has work to do thestar.com/politics/federal… via @torontostar #cdnpoli #cpcldr
Cameron Tulk retweeted

I've hesitated promoting this given the state of things, but I'll be talking about map animations using @Mapbox + #turfjs today at noon for their webinar series. You can sign up here if interested: mapbox.com/webinars/maptoca-… Thanks to @domlet for organizing

Cameron Tulk retweeted

This is tearing my family apart. My Ontario-raised wife says she’s making scalloped (rhymes with gallop) potatoes. I say she’s making scalloped (rhymes with call-up) potatoes. She doesn’t realize how wrong she is. #HappyEaster

Cameron Tulk retweeted

Wow: This new @NYTimes coronavirus map is so much easier to read than the bubble chart version.


Cameron Tulk retweeted

NEW: Tue 7 April update of coronavirus trajectories
Big changes here, so tonight’s thread will be fewer charts and more explanations.
Here’s the revamped daily deaths chart. I’ve switched from a 7-day rolling average to true daily numbers*
All charts: ft.com/coronavirus-latest

Cameron Tulk retweeted

How green is your neighbourhood if you don’t take into account parks?
#mapping #mapto #dataviz #toronto #opendata

Week 14: Which neighbourhoods are the greenest without their parks?
Thinking about limited park access to #FlattenTheCurve, we wanted to look at the inequality of greenery throughout the city #TorontoAtlas


Cameron Tulk retweeted

a clock-waveform might be a better approximation for how we think about clock time

Cameron Tulk retweeted

Satellites are getting smaller, lighter, and cheaper. The race is on: wsj.com/graphics/new-space-r…
Had a ton of fun collaborating with @iarynam on this one!


Cameron Tulk retweeted
Deeply-reported story on a corner of Canada's "new far-right," featuring 150k private messages, in Saturday's @globeandmail: theglobeandmail.com/canada/a… #cdnpoli
Cameron Tulk retweeted

#WeTheNorth Remembers
You’re unable to view this Post because this account owner limits who can view their Posts. Learn more

