

Clean charts, clear explanations. I try to keep technical analysis simple and accessible for anyone following along.
Joined July 2017
- Tweets132
- Following570
- Followers554
- Likes23.1K
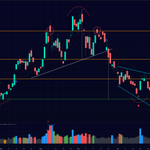
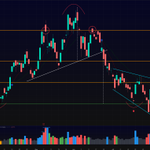

$IREN — short update
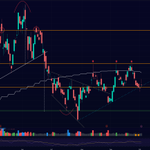
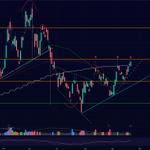
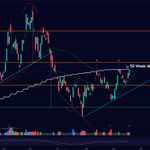
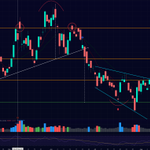
I don't usually post lower timeframes, but this 1H chart nicely illustrates a few things that often come up in discussions about technical analysis. Do trendlines really matter? Do price gaps from over a year ago still matter? And what about historical support and resistance, even after substantial dilution?
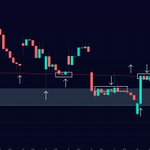
In Sunday's chart, I had marked a red descending trendline connecting several important lows over the past year (subjective and certainly not perfect), along with the remaining gap from August 2025.
Zooming in, the price reactions are quite remarkable. The trendline initially acted as support before price broke below it. Price then dropped into the gap, struggled around its upper boundary, and eventually filled the remaining gap yesterday.
What followed was a sharp reversal right into the same red trendline. Several attempts to reclaim it failed, and price eventually dropped back into the gap.
To me, that's a beautiful illustration of why these technical levels are worth watching - repeated reactions like these suggest that buying and selling interest is concentrated around such areas. Even levels from over a year ago or more can still matter.
But let's not get lost in the lower timeframes for too long. The bigger picture hasn't changed — yet.
NFA — educational observation from the chart.

$IREN into the new week:
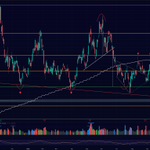
The selling continued. The red descending trendline connecting several important lows over the past year didn't hold. Neither did support at the top of the gap. Thursday and Friday both tested the broken trendline from below but failed to reclaim it. Friday closed at $24.91.
We're now trading inside the remaining gap from late August 2025. Its lower boundary is around $24.29 if we use the wicks, while the preceding candle closed at $23.04. Gaps often attract attention, but there's no rule that they have to close, nor any guarantee that price will find support there.
Below that, the next major technical reference is the 0.236 Fib at $22.06. To me, that's the next really important support to watch and potentially a more meaningful test of whether buyers are ready to step in.
Volume has been substantial throughout the selloff, although Friday's roughly 39 million shares were noticeably below recent peaks. RSI is deeply oversold around 24, but that's not a reversal signal on its own.
And that's where we stand. The downtrend remains intact, and I still don't see a convincing bottoming pattern. A bounce from one of these levels is certainly possible, but I'd want to see a clear reaction and some follow-through before becoming more constructive. For now, the chart hasn't given us that.
One reminder about the Fibonacci levels: mine are drawn from the April 2025 swing low at $5.13 to the ATH around $76.86. I still think these levels align well with how price has reacted over the past few months. But other anchors are certainly possible, and I've seen some interesting alternative retracements pointing to a broader area around $19–22, potentially worth watching for confluence.
NFA — educational observation from the chart.

$IREN into the new week:
Last Sunday I wrote that repeated tests of support aren't necessarily bullish without a sustained recovery. I didn't expect that warning to become relevant quite this quickly.
It's been a brutal week. First $35 gave way, then the 0.382 Fib at $32.53. Friday closed at $26.99, roughly 45% below the last rejection at the 0.618 Fib/$49.46 just over three weeks ago.
And the broader market environment isn't helping. Rising oil prices are adding to inflation concerns and fears of higher interest rates. CoreWeave's bond selloff then put the financing of the entire AI infrastructure buildout under scrutiny. IREN is getting caught up in that reassessment, despite a different business model built around owning its land, power and shells rather than leasing them. That distinction matters, but it doesn't make IREN immune to tighter financing conditions or a broader shift in sentiment.
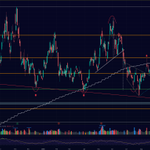
So what's left below? The red descending trendline roughly connects several important lows over the past year, and price is now testing it. Just below is historical support around $25.40, along with the remaining gap between $25.31 and $24.29 (shaded on the chart).
Further down, the $22 area coincides almost exactly with the 0.236 Fib at $22.06, probably the most important support left on this chart.
One interesting detail: the last three candles look surprisingly similar to the rather unspectacular bottom around December 16–17. A strong red candle, followed by green and red, with almost identical lows. This time Thursday and Friday's lows were just five cents apart. An interesting resemblance, but far too early to call it a bottom. RSI around 22 also shows how stretched the selloff has become.
And that's where I am this week. Unlike some of the previous setups, I genuinely don't have a strong view on where price goes next. I'd like to see the red trendline hold, but the downtrend is still intact and we need to see some convincing follow-through before calling a reversal.
NFA — educational observation from the chart.

$IREN into the new week:
Last week's chart had two possible paths. Price has now taken the second, less constructive one.
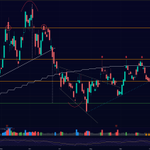
The 0.5 Fib at $41 was lost again on a closing basis, the rising trendline off the late-July low has broken, and Friday even dipped below the early-September low around $35. The sequence of higher lows that was still intact last week is now broken.
Looking back, the three failed attempts at the 0.618 Fib near $49.46 and the inability to reclaim the 50-week MA were already signs of weakening momentum.
There may still be some support around $35, where buyers have stepped in several times in recent months. Friday closed at $35.19, so we're already testing it.
If that area fails, the next obvious reference is the 0.382 Fib near $32.53, a level that has provided support several times already. Depending on how generously we count, another visit could be test number five. Quintuple bottom, anyone? ;-)
Of course, repeated tests aren't necessarily bullish. Without a sustained recovery, the risk of support eventually giving way increases.
On the upside, $41 would now be the first important level to reclaim, with the 50-week MA around $45.64 still overhead. But for now, the uptrend argument from last week is invalidated, at least on the daily structure we've been following.
NFA — educational observation from the chart.

$IREN into the new week:
Late September rejected the 0.618 Fib at $49.46 again, the third time that level has turned price around since the summer. The 50-week MA, reclaimed only briefly, was lost on the way down and has since behaved as resistance. From that high the daily has been a short-term downtrend, even while the larger structure off the late-July low is still a sequence of higher lows.
The last three sessions are where the chart gets interesting. Wednesday tested the 0.5 Fib near $41 and closed just under it. Thursday failed at the level and looked as if $41 was flipping from support to resistance. Friday was messy in the other direction: a wide range that ran toward $44, left a long upper wick, and still managed to close back above $41 at $41.76. Not a clean reversal candle, but the weekly close did reclaim the level.
From here the chart splits into two fairly clear paths.
If this retest holds and we get a proper reaction low, the rising trendline off the late-July bottom picks up a third touch. Thursday’s candle under the line can still be treated as noise if price stays above it. The higher lows since July 29 would remain intact, and the next attempt on $49.46 would have something to build from.
If the weakness continues and $41 is lost again on a closing basis, that level becomes resistance and the trendline argument gets much harder to defend. A move below the early-September higher low around $35 would break the pattern that has held since late July. Under that, the 0.382 Fib near $32.50 is the stronger support, the same zone that caught the summer washout.
RSI is neutral, so neither path is being forced by momentum. The next few closes around $41 should tell us which one the market is choosing.
NFA — educational observation from the chart.

ALT IREN 1D chart
IREN update:
• 50W MA reclaimed — 2 closes above it, first time since July 1st
• Ascending triangle still intact
• 0.618 Fib @ $49.46 rejected for the 3rd time
$49.46 remains the level to watch.

$IREN setup into next week:
On the daily, the structure is tightening: rising lows from the late-July bottom are forming an ascending triangle into flat resistance.
The immediate hurdle is the 50-week MA, which price has struggled to reclaim on a closing basis since early July. A daily close above it could be significant — not only would it clear a widely watched level, but a break and hold above the 50W MA could add fuel to the move as momentum traders react to the breakout.
That would put the $49.50 area — the 0.618 Fib and prior resistance — back in focus. Momentum is improving without RSI looking particularly stretched, so the interesting part now is whether price can turn the 50W MA from resistance into support.
If the breakout fails, the rising trendline and ~$41 area remain important levels to watch. Intuitively, though, this one looks like it’s getting ready to go.
NFA — educational observation from the chart.

Follow-up to the Aug 12 breakout note on $IREN.
Just over a week later and the chart has settled into a quieter but still constructive phase.
The falling-wedge breakout and clear of the 0.5 Fib (~41) held up well at first. Price pushed toward the 0.618 (~49.50), touched 49.19 on Aug 13, and was rejected. It has since pulled back and found solid support right back at that same 0.5 level — the classic resistance-turned-support flip we look for after a clean break.
Context helps explain the earlier drop: the large Head & Shoulders that formed across the May–June highs fully played out and delivered its measured move down to the 0.382 zone (~32.53) in late July. That low has held, and from there we now have a sequence of higher lows and a higher high into the mid-40s. Early signs of a potential trend change are visible, though it is not yet a fully confirmed daily uptrend.
The 9/21 EMAs have crossed bullish (42.25 / 41.46), adding a short-term constructive signal. RSI sits neutrally around 51 with room to move either way. Volume, however, remains mixed and has not expanded meaningfully on the upside days since the breakout. The residual descending channel from the June highs is still visible, and price is consolidating just above the breakout zone.
Key levels 0.5 (~41) needs to hold for the breakout thesis to stay intact. 0.618 (~49.50) is the next upside target — a decisive break on volume would open further room. 0.382 (~32.53) remains the strongest deeper support if a negative catalyst appears.
The Fibs continue to map the swings reliably, just as they have for months.
Two major events arrive this week: NVIDIA earnings on Wednesday and IREN’s own results on Thursday. Volatility is to be expected. Last earnings cycle we saw a strong rally of more than 30 % in the three days leading into the print.
Personally I’d prefer a quiet, low-volume start to the week, then a sustained uptrend once earnings give us a clearer picture of where the company is heading.
Educational observation only. Not financial advice — always do your own research and manage risk.

I still remember the amount of skepticism and bad takes around IREN’s AI pivot. A lot of people doubted they could pull it off.
Today those voices feel very far away.
Huge congratulations to @danroberts0101, Will Roberts and the entire @IREN_Ltd team. Big milestone.
Execution > narrative.
xitter.gq/IREN_Ltd/status/208786…

Horizon 1: delivered.
IREN has delivered Horizon 1 to Microsoft and achieved NVIDIA Exemplar Cloud status on NVIDIA GB300 NVL72.
Read more: iren.gcs-web.com/static-file…
$IREN broke out of the falling wedge today, and it did so in a decisive way.
Both the upper boundary of the wedge and the 0.5 Fib at ~41 have been cleared. If this breakout holds, that area should now flip from resistance into support, which would open the path toward the next Fib level at 0.618 (~49.50).
Volume on the breakout was solid relative to the recent range, though not yet at the heavier levels we saw during the stronger moves earlier this year. Continued expansion on follow-through days would make the breakout even more convincing.

Falling wedge on $IREN daily
After the sharp drop from the June highs, price has been grinding lower inside two converging downward-sloping trendlines (the petrol lines on the chart).
A classic falling wedge — a pattern that often looks bearish while it’s forming, but statistically resolves to the upside more often than not when it appears after a prolonged decline. Large-sample studies (Bulkowski) put the upward breakout rate around 68%, though the pattern ranks in the lower half of the bullish ones he tested.
Important confluence at the bottom: The lower boundary of the wedge lined up almost perfectly with the 0.382 Fibonacci (~32.53). That zone held, and price bounced hard from it.
Right now we’re testing the combination of:
• the upper wedge boundary
• the 0.5 Fib at ~41.00
A decisive daily close above both would confirm the pattern and open the door toward the next Fib level at 0.618 (~49.50), with room to run further if momentum follows.
Simple setup, clean structure, and the Fib levels continue to act as useful reference points.
This is not financial advice — just an observation of the technical structure on the chart. Always do your own research and manage risk.

IREN technical update – volatility included, patience required.
Wednesday’s candle swept liquidity below the important 0.382 Fib at 32.53. A decisive close and hold beneath that level would have damaged the overall structure of the chart. Instead price recovered.
Thursday then gapped up and opened almost exactly on the 0.382. Friday opened close to the 0.5 Fib (41.00) and was rejected. These reference points continue to do their job. The 0.5 remains resistance for now. Holding the 0.382 keeps the larger structure intact.
The Horizon 1 handover and acceptance by Microsoft is still the clearest near-term catalyst that could give the chart the energy it needs to turn more constructive. Macro noise remains a headwind, but the technical map is still readable and useful.
Educational only. DYOR as always...

Last Monday the daily chart delivered a clean textbook morning star right at the 0.382 Fib (~32.53) on expanding volume and constructive news. The three-candle structure did what it was supposed to do: it flipped short-term sentiment and carried price back above the 0.5 Fib at 41.00.
What followed has been less impressive.
The rally lost momentum quickly. On the 30-minute chart a repetitive pattern emerged—strong opening candles that were systematically sold into, producing a series of lower highs. I normally avoid living on the 30-minute, but the consistency of the distribution was hard to ignore. Thursday closed below 41, Friday gapped down, and the entire reversal move has now retraced more than 50 %.
We are back at a decision point that has already held three times. A successful defence of the 0.382 Fib keeps the larger structure intact. A decisive daily close beneath it would open the next Fib pocket and prior swing lows.
The Horizon 1 handover to Microsoft is still the next clear catalyst, but in this challenging macro environment expectations should stay measured.
Not financial advice.


Last Friday I noted that the 0.382 Fib zone looked like a logical spot for a triple bottom to form — and that we’d need real upside volume to confirm it.
Today the market is delivering exactly that. Strong buying interest and a clear surge in volume have accompanied price action that’s forming a classic morning star reversal pattern right at that key support (orange box).
A morning star is a three-candle bullish reversal after a downtrend: a long red candle, followed by a small-bodied “star” candle showing indecision, then a strong green candle that closes well into or beyond the first red candle’s body.
On $IREN this structure is lining up cleanly. The long red, small star, and today’s powerful green candle — which has already moved well above the first red candle’s entire body — all sitting at the 0.382 Fib.
For now, price has found resistance at almost exactly the 0.5 Fib level (~$41.00). As we head into the close, this setup is completing a textbook morning star reversal right at the 0.382 Fib support and marks a clear shift from defensive to constructive price action.
As always, not financial advice.

$IREN – Last week price settled almost exactly at $41, right on the 0.5 Fibonacci retracement. At the time it looked like we might have carved out the higher-low scenario.
Five red candles later we’re sitting at the next major level: the 0.382 Fib around $32.50.
This is the same zone I flagged as the measured target of the completed Head & Shoulders top (full breakdown here: xitter.gq/harctander/status/2072…).
It also lines up with the prior reaction lows from December ’25 and April ’26 — very solid confluence. A clean break below here would damage the structure and probably require more time to rebuild.
But if I have to choose a side right now, this still strikes me as a perfectly logical place for a bottom — in fact a classic triple bottom (marked on the chart). For the pattern to complete we’d want to see real upside volume appear next week. The upcoming handover of Horizon 1 to Microsoft looks like a natural catalyst that could supply exactly that.
As always, not financial advice — only my personal view after today’s session.

ALT Iren daily chart

ALT Triple Bottom

$IREN – Unfortunately, what began as a potential Head & Shoulders has now fully developed into a completed top. The pattern aligns remarkably well with the classic John J. Murphy criteria:
• A prior uptrend
• A left shoulder formed on heavier volume (point A), followed by a corrective dip to point B
• A rally to new highs on lighter volume (point C – the head)
• A decline that slips below the previous peak at A and approaches the prior low at point D
• A third rally (point E – the right shoulder) on noticeably lighter volume that fails to reach the head high at C
• A decisive break below the neckline — the final confirmation that completes the pattern
What’s the technical price objective?
It’s the vertical distance from the head (point C) down to the neckline, projected downward from the breakout point. That measured move targets around $32 — which also coincides with the 0.382 Fibonacci retracement level. The stock already found support there in both December ’25 and April ’26. Strong confluence.
From here, two main paths stand out:
• Price reaches the $32 zone, forms a triple bottom, and reverses higher, or
• The stock fights its way back above the 0.5 Fib level (~$41) and carves out a higher low on the higher time frame.
What are your thoughts?

$IREN – Quick follow-up on the two paths I laid out last week.
Two main scenarios stood out: either price works its way down to the $32 zone to form a triple bottom and reverse higher, or the stock fights its way back above the 0.5 Fib level (~$41) and carves out a higher low on the higher timeframe.
After today’s close, price settled almost exactly at $41 — right on the 0.5 Fibonacci retracement. (Quick refresher on how these levels are drawn: xitter.gq/HArctander/status/2066…?)
To me, this looks like a strong signal that we’ve bottomed here and successfully carved out that higher low on the higher time frame.
As @unaibld pointed out, there’s also a new trendline in play that connects this higher low with the prior lower low and extends back to at least June ’25. It’ll be interesting to see how well it holds from here.
And that green vertical line you’re probably wondering about? Well… there’s bullish news on the horizon...

$IREN – Unfortunately, what began as a potential Head & Shoulders has now fully developed into a completed top. The pattern aligns remarkably well with the classic John J. Murphy criteria:
• A prior uptrend
• A left shoulder formed on heavier volume (point A), followed by a corrective dip to point B
• A rally to new highs on lighter volume (point C – the head)
• A decline that slips below the previous peak at A and approaches the prior low at point D
• A third rally (point E – the right shoulder) on noticeably lighter volume that fails to reach the head high at C
• A decisive break below the neckline — the final confirmation that completes the pattern
What’s the technical price objective?
It’s the vertical distance from the head (point C) down to the neckline, projected downward from the breakout point. That measured move targets around $32 — which also coincides with the 0.382 Fibonacci retracement level. The stock already found support there in both December ’25 and April ’26. Strong confluence.
From here, two main paths stand out:
• Price reaches the $32 zone, forms a triple bottom, and reverses higher, or
• The stock fights its way back above the 0.5 Fib level (~$41) and carves out a higher low on the higher time frame.
What are your thoughts?
Haakon Arctander retweeted

Many of you know me from $IREN coverage, and having the OnlyFrans community behind my subscription button.
This may look like a straight-up paywall, but it's actually a platform where people are contributing not just $10 per month for new material, but also share research work, financial models, footage from events, meetups, and sometimes community members stumble upon alpha, that the OF'ers hear about first.
Today, I want to divert the spotlight to some of the brightest minds behind the OnlyFrans community:
@tykonu - possibly one of the best sleuths on this platform, responsible for finding Fireworks AMD cluster, and Baseten as customer.
@ShiftyUk59 - another sleuth, who is able to turn AI into alpha-scrapers, responsible for finding $NVDA HGX B300 exemplar validation.
@jiahanjimliu - needs no introduction, simply one of the brightest people you will encounter on X.
@Mining4Answers - has done extensive work on permitting, and new site discoveries.
@HArctander - incredibly strong with image enhancing, provides valuable TA.
There are a lot more interesting people that help build the community, attend events on behalf of OF, do site drive-by's, or simply provide emotional support during tough times.
This post is both a thank you to all of them, as well as an invitation to come join us.
We have a Discord, a community X group, and much more.
Being early is not always easy, but it gets a lot easier with like minded people doing research, and sharing ideas and theories.
xitter.gq/FransBakker9812/creato…

As discussed in the Fib guide, the 0.786 level at 61.51 has been acting as strong resistance. Price has tested it multiple times recently and got rejected each time.
Meanwhile, price has been making higher lows. This creates a simple pattern with a rising floor and a flat ceiling at 61.51. You can call it an ascending triangle, or just a consolidation with a rising bottom.
The pattern is getting mature, so it should break one way or the other soon. Right now there are two main possibilities:
Price pulls back toward the rising trendline first (somewhere in the mid-50s), or we get a clean break above 61.51 with decent volume.
RSI has cooled off since the last attempts, which is a small positive.
This is just how I’m reading the chart at the moment. Feel free to share your thoughts.
