




Pinned Tweet
Opendoor 2.0: The Singularity Scaler Nobody Is Pricing In
A road to a $1000 per share.
$OPEN is sitting at $4.42.
EBITDA profitable ahead of schedule. 5,000+ acquisition contracts in Q1 — best since 2022.
LTM free cash flow: +$519M. Was -$6.3B in 2021.
The market is still pricing it as a broken iBuyer.
It's becoming a housing OS.
Full breakdown 🧵

For those with an $OPEN -minded interest in understanding the company: it is all here in the opening paragraph of the Singularity Scaler thesis.
Substack: investwithfelix.substack.com…


"If we don't hit 5-10% market share in US Residential in the next 5 years, we should all be pretty disappointed right?" - Kaz
$OPEN is a 1000$ company in the making.


Opendoor 2.0: The Singularity Scaler Nobody Is Pricing In
A road to a $1000 per share.
$OPEN is sitting at $4.42.
EBITDA profitable ahead of schedule. 5,000+ acquisition contracts in Q1 — best since 2022.
LTM free cash flow: +$519M. Was -$6.3B in 2021.
The market is still pricing it as a broken iBuyer.
It's becoming a housing OS.
Full breakdown 🧵
It didn't feel good to buy more $IREN today in a -18% decline. But the technical picture does not lie. $IREN had a date scheduled with the SMA50 on the monthly basis. So I pulled the trigger and bought 10% more shares. Now massively up after hours.
The numbers back it up. Chips may decline, but IREN's cloud contracting is more durable long term.


🚨 $IREN: $22m / MW on a 5-year contract including 90% prepayment of GPU capex.
This is MASSIVE, wow... the demand for compute is unreal.


Hi Kaz
My main concern is: have we gotten far enough on 1P and 2P models? Can we credibly state its a product-market-fit on a state level?
Are the datasets deep enough on a granular level? Do we know enough about local consumer sentiment, turnover speed, spreads, and liquidity?
If $OPEN accelerates to 3P without nailing fundamentals I think there’s a risk for the business model.
I flagged this specifically as a bear case so would love to hear your thoughts now or during earnings call. Expecting a breakdown.
Felix

Invest with Felix retweeted

anthropic is probably the best business in AI right now and i still wouldn’t touch it on day one. the whole thing is set up for suppliers and insiders to sell into the index buying.
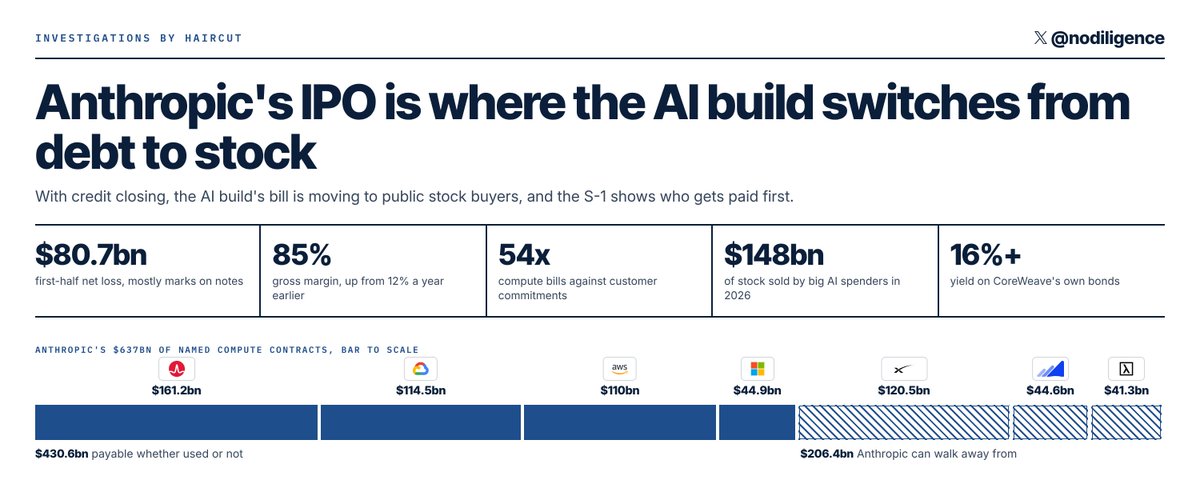
I bought more $IREN today at $25. Anthropic numbers defy current doubt and nobody played “data center Catan” as well as $IREN - hoarding the power, GPUs to build the cities while everyone was selling rocks and wheat for bricks and wood 😉

Yo @elonmusk, I'm really happy for you, I'ma let you finish, but $IREN is building the most durable AI Cloud and Data Center platform of all time.
The market seems to be in agreement. Sell $SPCX and Long $IREN to the moon 🚀🚀🚀🚀🚀
@elonmusk, I’ll bet you $1,000,000 that $IREN reaches $420.69 (16x) before $SPCX reaches $1,000 (7x). I can send it via X-Money, bitcoin, or dogecoin. Your choice. Happy to raise it to $4,200,00.69 for $469 $IREN before $900 $SPCX.
Send me location. Wen deal?


It’s gonna be an absolutely ruthless rebound for $OPEN when yields drop 📉
Days to cover climbed from 9.97 to 10.67.
At this point it’s not if but when…

Bought more $ZETA today. Not a major holding but it’s a quality company that truly understands how to apply AI to business impact.
New WS price targets come in at $45-55… what a change of events for the company, dipping in the mid 10s early this year.
$OPEN holders have unmatched endurance
Opendoor is truly in a wild place:
the 10Y yield that is tearing down $OPEN stock price while management is executing better and reshaping the business. However the market doesn’t reward it.
$OPEN is no longer a meme stock.
It's a mortgage rate with a ticker.
Mortgage rates just broke 7% for the first time since January 2025. The 10-year Treasury hit a 19-year high.
Despite this pressure on the stock price, the reversal can be even more dramatic.
I ran 1,461 days of data. The 30-year Treasury, the one on every chart, is the weakest signal of the lot. The mortgage rate explains about 90% of where OPEN has traded since May.
That's the bad news.
What should make every bear nervous is that the same math runs in reverse.
I built a formula that prices OPEN at every mortgage rate from 7.50% down to 6.00%. There's a rate where it roughly doubles from here.
But right now, OPEN is trading about 16% above where rates say it should be.
Either the market knows something the rates don't, or the stock is about to catch down. Historically, half of a gap like that closes in about four trading days.
Meanwhile, Opendoor is quietly selling 6.5% mortgages in a 7% market. It's not free, and I show what it really costs them.
Full breakdown below.

If AI models receive access to proprietary data, a company is giving its edge away and commoditisation of knowledge begins.

$ABCL its price movement gives me $HOOD vibes.
Check out the similarities between $ABCL today on the monthly chart and where $HOOD was in 2024.
Both breakouts were violent, with strong support on their key trendlines: the SMA20 and EMA20 1 month. Both tested them again, a panic hammer under it, and then ripped off.
Missed $HOOD back then, but now in both. 3x on shares in $ABCL so far.


Look at the negative divergence starting to appear on the US10Y and positive divergence at $OPEN.
Writings are on the wall. At least short term we may see a relief coming soon as buying power on the 10Y starts to fade.


Opendoor is truly in a wild place:
the 10Y yield that is tearing down $OPEN stock price while management is executing better and reshaping the business. However the market doesn’t reward it.
$OPEN is no longer a meme stock.
It's a mortgage rate with a ticker.
Mortgage rates just broke 7% for the first time since January 2025. The 10-year Treasury hit a 19-year high.
Despite this pressure on the stock price, the reversal can be even more dramatic.
I ran 1,461 days of data. The 30-year Treasury, the one on every chart, is the weakest signal of the lot. The mortgage rate explains about 90% of where OPEN has traded since May.
That's the bad news.
What should make every bear nervous is that the same math runs in reverse.
I built a formula that prices OPEN at every mortgage rate from 7.50% down to 6.00%. There's a rate where it roughly doubles from here.
But right now, OPEN is trading about 16% above where rates say it should be.
Either the market knows something the rates don't, or the stock is about to catch down. Historically, half of a gap like that closes in about four trading days.
Meanwhile, Opendoor is quietly selling 6.5% mortgages in a 7% market. It's not free, and I show what it really costs them.
Full breakdown below.
$OPEN holders when they see the 10Y yield drop below 4.7% again and the stock starts ripping
Opendoor is truly in a wild place:
the 10Y yield that is tearing down $OPEN stock price while management is executing better and reshaping the business. However the market doesn’t reward it.
$OPEN is no longer a meme stock.
It's a mortgage rate with a ticker.
Mortgage rates just broke 7% for the first time since January 2025. The 10-year Treasury hit a 19-year high.
Despite this pressure on the stock price, the reversal can be even more dramatic.
I ran 1,461 days of data. The 30-year Treasury, the one on every chart, is the weakest signal of the lot. The mortgage rate explains about 90% of where OPEN has traded since May.
That's the bad news.
What should make every bear nervous is that the same math runs in reverse.
I built a formula that prices OPEN at every mortgage rate from 7.50% down to 6.00%. There's a rate where it roughly doubles from here.
But right now, OPEN is trading about 16% above where rates say it should be.
Either the market knows something the rates don't, or the stock is about to catch down. Historically, half of a gap like that closes in about four trading days.
Meanwhile, Opendoor is quietly selling 6.5% mortgages in a 7% market. It's not free, and I show what it really costs them.
Full breakdown below.
Finally these leaps $250C exp Mar27 start to come alive $NVDA

First positive divergence appears on $OPEN daily chart.
A possible sign of reversal starts to occur with prices dropping further while RSI indicates buyer’s strength returning
