

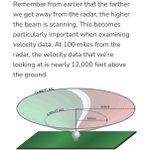



- Microwave Sickness claim: Symptoms such as headaches, fatigue, anxiety, and sleep disturbances have been reported in some occupational studies involving high RF exposures at close range. However, these symptoms are nonspecific and establishing RF exposure as the cause has proven difficult. NEXRAD antennas are elevated 33-115ft AGL, with the main beam angled upward at ~0.2-0.5 degrees. This keeps the beam well above most residential areas near the tower, and the general public is not exposed to the amount of RF radiation as occupational workers like technicians.
roc.noaa.gov/public-document…
- Occupational Insomnia claim: The studies involve radar workers/techs exposed to 14–18 GHz pulsed RF. NEXRAD operates at approximately 2.7–3.0 GHz. 14-18 GHz is a different frequency range with different propagation and absorption characteristics, but more importantly the workers in those studies experienced substantially greater and more prolonged exposures than members of the general public. NEXRAD technicians also follow strict procedures that require turning the radar off during maintenance near the unit. Extrapolating occupational findings to the general public is not scientifically justified.
weather.gov/media/directives… (see 17-B-1)
- EEG and Sleep Architecture claim: Some lab studies have reported subtle EEG changes following RF exposure, but reviews of the literature consistently note that findings are mixed and often contradictory, with some studies showing increases, decreases, or no changes at all. Observed EEG changes do not automatically imply poorer sleep quality, insomnia, or adverse health effects, and these studies generally involve controlled exposures that cannot be directly extrapolated to NEXRAD weather radar exposure.
pubmed.ncbi.nlm.nih.gov/3121…
pubmed.ncbi.nlm.nih.gov/3114…
- Distance and Exposure claim: While power density decreases with distance per the inverse square law, the stated numbers are highly misleading and do not reflect real world exposure. Using a simple power density calculator with 750kW peak power, 45.5dB gain, and 3,800ft distance yields ~158mW/cm^2. However, this represents peak, on axis, continuous wave power density directly in the center of the main beam (essentially it assumes the beam is locked directly on you at full power). In reality, the beam points overhead and scans past any fixed ground location. NEXRAD is a pulsed radar with a very low duty cycle (max ~0.2%). Its average transmitted power is on the order of 1kW (roughly several hundred to ~1,500W depending on operating mode). Applying this average power to the same calculator gives ~0.32mW/cm^2, already far lower - and this still ignores beam rotation, elevation scanning, and off axis positioning. Actual ground level exposure is substantially lower (~0.1mW/cm^2 or less) than the peak power calculation because of the low duty cycle, antenna rotation, beam elevation, and off axis positioning.
everythingrf.com/rf-calculat…
roc.noaa.gov/public-document…
radartutorial.eu/01.basics/D…
weather.gov/media/directives… (17-B-1)
Concerns about RF are valid, as RF can have biological effects at high levels, but this post conflates occupational exposures, different radar systems, different frequencies, and laboratory studies with the much lower exposures experienced by the public near NEXRAD installations. It also relies on peak power calculations that do not represent real world exposure from a rotating, pulsed weather radar. After more than three decades of nationwide NEXRAD operation, there is no credible evidence of widespread health effects among populations living near these radar installations.
unavailable
.@Windycom doesn’t have direct access to the raw data feeds from every radar network, so in some cases they rely on publicly available static radar imagery instead. For Jamaica, they appear to use the free radar images published by the Meteorological Service of Jamaica: metservice.gov.jm/daily-fore…
The numbers visible on those images match the reflectivity (dBZ) color scale. Windy essentially downloads the radar image, attempts to isolate only the radar echoes, and then converts that information into vector data for display on their website.
The challenge is that the images contain more than just radar returns - including color bars, labels, rang rings, etc. Removing those elements cleanly can be difficult without also accidentally removing or altering actual radar data. It also appears the color bar font may have recently changed to a bolder style, making it stand out more prominently and bypassing whatever method they are using to parse out the data compared to several month ago when this radar data was added: community.windy.com/topic/42…

unavailable


In conclusion:
Yes, contrails do have a non-zero weather modification effect, just as all natural clouds do. They alter the local radiation budget, release/absorb latent heat, and create small disturbances in the atmosphere. But the latest, most advanced modeling (Schumann & Seifert 2025) shows those disturbances behave like tiny perturbations that quickly grow via the butterfly effect - becoming indistinguishable from random atmospheric noise after just a few days. The changes are real but minor, with patterns similar to random noise yet far weaker and easily dominated by the much larger ambient weather systems. They’re local, chaotic, and unpredictable. It’s chaos theory in action.
Final Thoughts:
It would be scientifically unsupported (and misleading) for any credible meteorologist to claim "secret programs" are exploiting contrail radiative forcing to steer or control weather with precision. The 2025 paper gives three definitive reasons why that’s impossible:
1. The Power of the Background State:
Weather changes are "more strongly controlled by the ambient weather state than by the amplitude of the disturbances." Existing synoptic-scale weather patterns and jet-stream dynamics are so massive that contrail effects get drowned out. You can’t steer a cruise ship by throwing pebbles off the side.
2. The Chaos Barrier:
Contrails trigger a "butterfly effect." Even if a program could perfectly place a contrail, the resulting atmospheric response becomes indistinguishable from "random numerical noise" within a few days. You cannot have "precision control" over a system that is unpredictable.
3. Non-Linearity:
A factor-of-100 change in the initial disturbances produced almost no change in the resulting weather oscillations. There is no "volume knob" for this effect. Increasing the amount of contrails does not yield a linear, predictable increase in the weather result.
The Verdict:
Contrails are a byproduct of aviation that adds a small, chaotic "ripple" to our atmosphere. However, the idea that they can be used to pinpoint temperature targets or steer storm tracks is scientifically unsupported. In the tug-of-war of Earth's weather, the massive energy of natural synoptic weather always wins, leaving contrail effects as nothing more than unpredictable background noise.

This post overlooks some key meteorological basics. Contrail formation and persistence depend on relative humidity with respect to ice (RHi), not water (RHw).
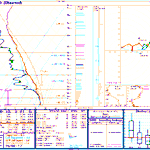
Given the raw radiosonde data from spc.noaa.gov/exper/soundings…, RHi can be calculated with simple saturation vapor pressure formulas (library.wmo.int/viewer/68695… [Page 197]).
From that sounding, there are several upper level layers with ice supersaturation (RHi > 100%), ideal for persistent contrails:
Additionally, estimating contrail heights from satellite long-wave IR brightness temps isn't reliable due to the optical thickness of contrails and cirrus, along with fundamentals of radiative transfer - both well established in the science. I've covered this previously:
xitter.gq/MetEduc/status/1973827…
Essentially, infrared radiance observed by the satellite instrument is a combination of that emitted by the surface, atmosphere, and the thin cloud itself - leading to warmer brightness temperatures. Inferring cloud height based on these warmer temperatures will results in significant underestimation.
amt.copernicus.org/articles/…
ndl.ethernet.edu.et/bitstrea…
rammb2.cira.colostate.edu/wp…
web.archive.org/web/20161222…


All these chemtrail debunkers just do is LIE.
Here's the upper air sounding from KIAD less than 30 miles from my location this morning! The chemtrails should have had reflective temps of -50C.
Instead we see them as warm as -8C!!!!!! Not to mention RH wasn't over 90%!!!!
So we get reflective temps of -8C to -25C below 450mb!!!
The US Govt and debunkers are good at one thing. LIES!
#chemtrails


Matthew Kennedy uses a single flight level, which is ok as a reference point. However, we know aircraft operate within a range of altitudes (the flight envelope which is typically 30,000 - 43,000ft).
He also incorrectly relies on average RHi to argue that persistent contrails are impossible, claiming the average RHi over Charleston is too low and that any contrails must therefore sublimate quickly. Aircraft do not fly through “average RHi.” A climatological average cannot predict what happens at a specific time, location, and altitude. The atmosphere is highly stratified, and conditions can vary dramatically over short vertical distances. Ice supersaturated regions (ISSR's) have been recorded being extremely thin - a few hundred feet thick.
Additionally, I assume he is deriving his averages from radiosonde climatology. Soundings at Charleston are normally launched only twice daily (00Z and 12Z), with occasional extra launches for special weather events. These balloons provide point measurements in both time and space and can easily miss ISSR's entirely. Not to mention that some radiosonde humidity sensors are known to have a dry bias, especially in cold, dry upper-tropospheric air, due to radiative effects.
This study alone found ISSR's at cruising altitude (FL300 - FL430) on 40% of the days (annually) with monthly variations from 36-50%:
mdpi.com/2226-4310/11/7/587
Replicating this study over Charleston, SC using IGRA data (ncei.noaa.gov/products/weath…), we find that ISSR's are present nearly 28% of the days (annually) with monthly variations from 22-34% between 2015-2026.
HOWEVER, if we break the data down and look at the number of levels recorded by each radiosonde within the defined cruising altitude as well as monthly ISSR detection, you'll see a jump between 2023 and 2024. This jump aligns with the transition to modern radiosondes that provide a much higher vertical resolution. This upgrade allows us to detect thinner ISSRs that older model radiosondes simply flew right past or lacked the sensitivity to detect.
This shift is strikingly clear if we break the data into two distinct eras:
Older Sensors (2015–2022): ISSRs were detected on 23% of days annually, with monthly averages ranging from 12% to 37%.
Newer Sensors (2023–2026): ISSR detection jumps to 39% annually, with monthly averages ranging from 17% to 70%.
This 16% jump in the annual average perfectly illustrates how these upgraded radiosondes allow us to look at much thinner slices of the atmosphere to accurately identify ISSRs. Keep in mind this is solely from balloons launched at a single location, typically only twice a day. Think of all the ISSRs that pass overhead in those unmonitored 12-hour gaps!
Code to parse through IGRA data and produce plots available upon request.


S Carolina H4624 Clean Air Act by @LeeGilreathSC Mathew Kennedy, Charleston SC-Farm Owner. Testimony on eliminating what is NOT happening, the science & mathematics of why persisting contrails ARE NOT just water vapor.
-Distance to the horizon 6miles
-The density of H20 is higher than that of jet fuel
-Took the 4 most common airliners for the study
-Took altitude & Speed ranges as averages
-Time, Distance/Speed & fuel as burn rate * time = 9.5-11 Gal H20 used over the 6 miles
-Question: would these contrails form ice crystals by a jetliners exhaust due to combustion, that persist in the sky remain for seconds, minutes & hours
-In any instance where RHI (relative humidity index) under these circumstances is a DECAY function or a negative, contrails will shrink: solid state to gas state
-Formula verified w/ 4 yrs of top pier reviewed journals
-Modeled SC's low and high RHI to calculate how long a frozen water contrail should last - 45 seconds to 82 seconds
-According to RHI modeling, SC Contrails consistently should be non persistent
-Daily occurrence of water vapor contrails is not what is showing persistent across the horizons
-What is it if its not ice crystals??!!