

Home builder🏠, market junkie🏛️, crypto investor📈. Using market data/technical analysis to assess trends. Nothing I post is financial advice. It’s my opinion.
Joined March 2024
- Tweets2.2K
- Following30
- Followers408
- Likes292




Pinned Tweet
TLDR: bitcoin:native is at a major crossroads, and if the bulls can’t take control here around 60K, this could get very, very ugly. However, the technicals favor the bulls in my opinion. There’s lots going for them.
Let’s get into it…
The Chart ///
Lots of people are looking at the current situation, but let’s zoom out here. Going all the way back to 2024, you’ll see that there was a bearish divergence, showing us that the peak in 2025 was near (green trend line in the weekly RSI).
What’s interesting, is that RSI trend line was broken a few months ago with our previous peak. We also crossed the 200SMA, which got everyone bullish, thinking this was the next big move.
However, from there, obviously we broke back down, but a trend line break is still a break.
Here’s where it gets more interesting… once that line broke and we dove to our current levels, we just closed our weekly RSI now forming the red trend line seen at the bottom. The problem is, we need a green week this week ahead to bounce, and move that RSI up to REALLY confirm the line is support.
For that reason alone, this week coming up is more critical than many have been in YEARS.
Liquidity ///
Here we have six charts… price, spot CVD, futures CVD, funding rate, and open interest. Since before the peak of our previous move, spot and futures have given way, largely leading to our current tumble down.
Interestingly, open interest has been up slightly as futures CVD fell, meaning shorts are entering aggressively, but in these scenarios of cascading, we usually expect OI to plummet as a sign of an end.
We are starting to see that at 62K, but the liquidation map shows us where our cascade will really likely end.
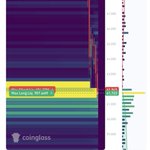
Liquidation Heatmap ///
As you can see, there is about 5B sitting between the current price and 60K… yes, 5 Billion… on the yearly timeframe.
Liquidity of that size rarely gets left alone, especially when price is so close. I expect a sweep of that to be our first major next stop. After-all, someone’s gotta feed the hungry Binance monster. 👹
After that, liquidity appears to be above, with 11-15 billion resting between current price and 87K. Will price move up? Let’s hope so.
The Institutions ///
Last but not least, let’s look at the Coinbase premium. Interestingly, the premium has been moving up during this major sell off, suggesting that institutional selling in the US is slowing against offshore long liquidations.
This is a good sign, and suggests that while yes spot is still selling, it’s slowing, and we desperately need spot CVD to flatten to give us any hope.
The conclusion ///
The most likely next stop is 60K to sweep the 5B in liquidity. After that, the crypto market makes a major decision.
Break to new lows, and a way bigger scale bear market could be upon us. But a lot can be said for the bulls…
-15B in liquidity above with record net shorts
-Coinbase premium rising
-support line on weekly RSI
-possible inverse H&S in the price action
Still, with market conditions tightening, rate hikes on the table, and the S&P wobbling, things don’t look great.
Saying this is a big week is a major understatement. Let’s see how this goes… ⏰


Here comes the bitcoin:native sweep of yearly liquidity.
Moment of truth… 🍀


TLDR: bitcoin:native is at a major crossroads, and if the bulls can’t take control here around 60K, this could get very, very ugly. However, the technicals favor the bulls in my opinion. There’s lots going for them.
Let’s get into it…
The Chart ///
Lots of people are looking at the current situation, but let’s zoom out here. Going all the way back to 2024, you’ll see that there was a bearish divergence, showing us that the peak in 2025 was near (green trend line in the weekly RSI).
What’s interesting, is that RSI trend line was broken a few months ago with our previous peak. We also crossed the 200SMA, which got everyone bullish, thinking this was the next big move.
However, from there, obviously we broke back down, but a trend line break is still a break.
Here’s where it gets more interesting… once that line broke and we dove to our current levels, we just closed our weekly RSI now forming the red trend line seen at the bottom. The problem is, we need a green week this week ahead to bounce, and move that RSI up to REALLY confirm the line is support.
For that reason alone, this week coming up is more critical than many have been in YEARS.
Liquidity ///
Here we have six charts… price, spot CVD, futures CVD, funding rate, and open interest. Since before the peak of our previous move, spot and futures have given way, largely leading to our current tumble down.
Interestingly, open interest has been up slightly as futures CVD fell, meaning shorts are entering aggressively, but in these scenarios of cascading, we usually expect OI to plummet as a sign of an end.
We are starting to see that at 62K, but the liquidation map shows us where our cascade will really likely end.
Liquidation Heatmap ///
As you can see, there is about 5B sitting between the current price and 60K… yes, 5 Billion… on the yearly timeframe.
Liquidity of that size rarely gets left alone, especially when price is so close. I expect a sweep of that to be our first major next stop. After-all, someone’s gotta feed the hungry Binance monster. 👹
After that, liquidity appears to be above, with 11-15 billion resting between current price and 87K. Will price move up? Let’s hope so.
The Institutions ///
Last but not least, let’s look at the Coinbase premium. Interestingly, the premium has been moving up during this major sell off, suggesting that institutional selling in the US is slowing against offshore long liquidations.
This is a good sign, and suggests that while yes spot is still selling, it’s slowing, and we desperately need spot CVD to flatten to give us any hope.
The conclusion ///
The most likely next stop is 60K to sweep the 5B in liquidity. After that, the crypto market makes a major decision.
Break to new lows, and a way bigger scale bear market could be upon us. But a lot can be said for the bulls…
-15B in liquidity above with record net shorts
-Coinbase premium rising
-support line on weekly RSI
-possible inverse H&S in the price action
Still, with market conditions tightening, rate hikes on the table, and the S&P wobbling, things don’t look great.
Saying this is a big week is a major understatement. Let’s see how this goes… ⏰
2
110
Bitcoin dominance attempt to touch back in the red channel. Fail.
Still falling 👀

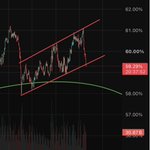
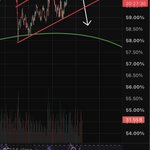
bitcoin:native Dominance update…
Daily five month RSI trend break ✅
Daily five month dominance bear flag break ✅
Weekly one and a half year RSI break (up next?)
Weekly four year dominance elliptical close below trend line (pending)
In just seven days we went from the top of the half year Bitcoin dominance daily bear flag range to breaking beneath it.
Bitcoin dominance is dropping quickly…


53
I agree with this train of thought…

🚨 December could be the Fed's last rate hike.
While everyone is expecting more hikes in 2027, several economic risks suggest the Fed may have to stop much sooner.
And there are 4 major reasons for this:
1. Inflation: November CPI could come in at 0% or even -0.1% month-over-month. Falling oil and gasoline prices could help bring inflation down.
2. Housing: Mortgage rates are already around 7.4%-7.5%, while home sales are falling. More hikes could push housing into a crisis similar to that of 2007-2008.
3. AI slowdown: AI investment has contributed roughly one-third of U.S. growth. But AI stocks are falling, borrowing costs are rising, and further hikes could seriously hurt GDP.
4. Iran war: Democrats are planning to put an end to the Iran war in Jan 2027. If the war ends and oil shipments through the Strait of Hormuz recover, energy prices could fall further, easing inflation pressure.
The Fed's dot plot suggested cuts at the beginning of 2026, but the opposite happened.
The same could happen in 2027.
Instead of more hikes, the Fed may be forced to pause or even cut rates to prevent a recession.

54
bitcoin:native Dominance update…
Daily five month RSI trend break ✅
Daily five month dominance bear flag break ✅
Weekly one and a half year RSI break (up next?)
Weekly four year dominance elliptical close below trend line (pending)
In just seven days we went from the top of the half year Bitcoin dominance daily bear flag range to breaking beneath it.
Bitcoin dominance is dropping quickly…
Insanity. How is a hike supposed to help when the root cause is an oil supply shock?
Duuuumb…
🚨 FED COULD DO A 50 BPS HIKE NEXT MONTH
The FOMC minutes have been released, and it's very hawkish.
Fed officials say that the labor market is strong, GDP is growing at a rapid pace, and inflation is the biggest concern.
Right now, inflation is also spreading into the sector that isn't related to oil, which means aggressive hikes are needed.
The Fed also flagged risks that AI investment could turn out to be disappointing for investors, especially banks.
Currently, there is almost a certainty of a rate hike next month; however, after today's FOMC minutes, the markets might start taking a 50 basis points hike seriously.


67
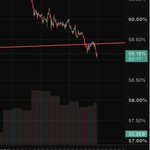
Does bitcoin:native dominance bounce? Or do we break through the bear flag?
Something is happening 👀


bitcoin:native dominance is breaking down and no one is talking about it.
I know everything’s hitting the fan. Rates are up, liquidity is low, the markets dumping, etc… All bad things for crypto.
But look at that weekly timeframe for Bitcoin dominance. A four year (ironic timeframe) elliptical pattern coming to a close it seems, and the RSI on the daily just broke.
I know a BTC.D breakdown doesn’t mean crypto goes up. But alts are doing something interesting. I don’t know what it is yet, but I’m here for it.


Interesting…

Federal Reserve Governor Chris Waller:
The bank monopoly in payments is breaking down due to rising crypto and blockchain competition.
🫡 @EleanorTerrett


1
59
bitcoin:native dominance is breaking down and no one is talking about it.
I know everything’s hitting the fan. Rates are up, liquidity is low, the markets dumping, etc… All bad things for crypto.
But look at that weekly timeframe for Bitcoin dominance. A four year (ironic timeframe) elliptical pattern coming to a close it seems, and the RSI on the daily just broke.
I know a BTC.D breakdown doesn’t mean crypto goes up. But alts are doing something interesting. I don’t know what it is yet, but I’m here for it.


🚨 Something seriously wrong is happening with America's critical infrastructure.
In just 3 working days, major systems across the US have faced serious disruptions.
Thursday: Microsoft suffered a global outage, affecting Outlook, Teams, and other services.
Friday: The FAA grounded flights nationwide for nearly 5 hours after a communications failure.
Monday: Customers of major US banks, including JPMorgan Chase, Bank of America, and Wells Fargo, reported banking outages.
First, millions of people faced disruptions to their work. Then air travel was brought to a halt. And now people are reporting problems accessing their money.
This really looks suspicious.
1
54
Damnit… are we about to dump…?

Why are crypto prices down?
No one knows for sure. Correlation does not prove causation. Here are some potential reasons.
Money shifting to the Anthropic IPO: xitter.gq/ColeMacro/status/21212…
ETF outflows: U.S. spot Bitcoin ETFs saw about $1.9 billion in outflows over seven trading sessions through November 13. Ether funds also saw withdrawals. crypto.news/bitcoin-price-fa…
Security fears: the Binance hack, iPhone-linked crypto wallets drained, Chrome exploit, Microsoft down. These security incidents could make some people less willing to keep funds in crypto.
Hot U.S. inflation has raised expectations of another Fed rate hike. Higher yields and a stronger dollar can weigh on "riskier assets" such as crypto.
Political uncertainty: Midterm results have raised concerns about potentially stricter U.S. crypto policy.
No, Binance did not sell crypto.
I bought crypto in the past few days, as I got some stablecoins recently. (maybe this is the cause 🤣)
Mid-long term, crypto will continue to grow.
Views are my own. Not financial advice.
For future reference, price of BTC hit a low of $62,006 today.

1
63
If you think ripple:native isn’t going back up eventually, you don’t understand liquidity markets…

2
91
$5B in cumulative long bitcoin:native liquidations down to $60K?
Yeah I’m sorry, we’re going back there at this point before any chance at higher…

1
53
It would be pretty hilarious if we had this massive dump which “just so happened” to sweep the massive 1Y liquidity, then had just like a massive God candle up to crush the shorts.
In like 4 days Binance could have their $6B and then some. 😂
49

Something feels significant about Bitcoin Dominance RSI and this flush breaking at the same time. Not sure what to think yet, but you don’t break a half year dominance RSI trend line alongside a massive flush if there’s nothing significant happening IMO.

3
149
LOL and CZ at the jump was again all like “This things amazing” 😂. Always the opposite of that man’s word.


1
121