

I price where options are rich, cheap, and lying. VRP · Skew · Earnings implied vs realized · Risk · Premium seller. Not financial advice.
- Tweets9.2K
- Following645
- Followers7.8K
- Likes8.6K






ALT Card: long $VIX funds over the past year, Oct 27 2025 to Oct 26 2026. Two big numbers: $VIXY, which holds the nearest futures, lost 43.6%, and $VIXM, which holds later futures, lost 16.0%. Line chart of both daily closes from the same starting point, with $VIXY ending well below $VIXM. Bottom tile: $VIXM rose 22.6% on Aug 5 2024.

ALT Card: $SVIX, a fund short $VIX. Big number: a 38.9% drop for $SVIX in one session on Aug 5 2024. Small line chart of the $SVIX daily close from Mar 2022 to Oct 2026, with a dot at the bottom of the Aug 5 2024 drop. Below it: 58.2% up days since Mar 2022.


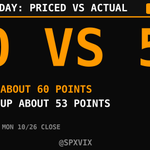
ALT Card showing $SPX for Monday 10/26, priced move versus actual move. Big numbers read 60 VS 53. Priced: about 60 points. Actual: up about 53 points. Measured from Friday's close to Monday's 10/26 close.


ALT Card titled SPY GEX map, from Oct 26 at 2:50 PM ET. Tiles: SPY spot 765.33, net gamma exposure for options out to 30 days negative 8.6 billion dollars, gamma flip 763, put wall 755, call wall 765. Below, a bar chart of net gamma exposure by strike from about 728 to 803, in millions of dollars per 1% move. Strikes below 763 are mostly negative, with the largest bar at 755. Strikes from 763 up are mostly positive, with the tallest at 765, though 766 and 767 are negative. Lines mark the flip, put wall, call wall and spot.

ALT Leaderboard card titled SPX TOP 20 25 delta skew, Oct 26 at 1:36 PM ET. It ranks the 20 largest SPY holdings by 25 delta put implied vol divided by 25 delta call implied vol for the Nov 27 expiry, 32 days out. SPY reads 1.324. The top 20 average is 1.051, weighted 1.074. Highest are V 1.175, AAPL 1.172, NVDA 1.111 and JPM 1.110. Then XOM 1.091, PLTR 1.075, MSFT 1.072, AMZN 1.061, LLY 1.060, JNJ 1.041, MU 1.038, TSLA 1.035, AMD 1.033, ABBV 1.030 and AVGO 1.024. GOOGL 1.002 and META 0.999 are flat. MA 0.969, COST 0.969 and WMT 0.955 have calls priced over puts. Every name sits below SPY.


ALT Table "Earnings Week 10/26-10/30", card 1 of 2, 11 companies reporting this week, by day, before open (BMO) then after close (AMC). Each row: Friday 10/23 close; implied move for this print from the at-the-money straddle; average implied move over the last 8 prints; first open after those 8 prints below/inside/above the priced range; average absolute close-to-close move. VZ Mon BMO: 44.66, 4.4%, 4.2%, 0/7/1, 4.0%. KO Tue BMO: 92.71, 3.3%, 2.9%, 1/3/4, 2.8%. BA Tue BMO: 188.35, 5.7%, 5.0%, 0/7/1, 3.7%. GLW Tue BMO: 123.69, 9.2%, 7.7%, 1/5/2, 6.2%. V Tue AMC: 407.92, 3.4%, 3.4%, 0/6/2, 2.3%. STX Tue AMC: 630.49, 9.9%, 9.4%, 1/5/2, 10.2%. GOOGL Wed AMC: 320.21, 6.1%, 6.2%, 2/5/1, 4.1%. MSFT Wed AMC: 524.51, 5.2%, 5.1%, 2/3/3, 7.0%. NOW Wed AMC: 158.96, 10.3%, 8.6%, 3/3/2, 8.8%. FTNT Wed AMC: 179.99, 12.0%, 10.5%, 2/5/1, 9.4%. LLY Thu BMO: 1273.46, 6.6%, 6.3%, 3/5/0, 8.0%.

ALT Table "Earnings Week 10/26-10/30", card 2 of 2, 10 companies reporting this week, by day, before open (BMO) then after close (AMC). Each row: Friday 10/23 close; implied move for this print from the at-the-money straddle; average implied move over the last 8 prints; first open after those 8 prints below/inside/above the priced range; average absolute close-to-close move. MA Thu BMO: 623.60, 3.6%, 3.0%, 1/7/0, 2.3%. MRK Thu BMO: 145.27, 5.2%, 5.0%, 1/7/0, 2.4%. CAT Thu BMO: 687.00, 7.8%, 5.3%, 1/4/3, 4.8%. BMY Thu BMO: 61.48, 5.5%, 4.7%, 0/8/0, 4.3%. MO Thu BMO: 74.31, 4.0%, 3.6%, 2/5/1, 5.4%. AMZN Thu AMC: 248.00, 7.9%, 7.1%, 2/3/3, 6.2%. INTC Thu AMC: 86.96, 9.9%, 9.8%, 3/4/1, 9.3%. XOM Fri BMO: 183.21, 3.9%, 2.4%, 0/7/1, 1.1%. ABBV Fri BMO: 285.64, 4.8%, 4.4%, 1/6/1, 3.5%. CVX Fri BMO: 233.21, 3.9%, 2.5%, 0/7/1, 2.4%.


