

Urgent Medical Appeal 🚨 |HelpMeRaise17mForSurgery Proof pinned below 👇
🇳🇬Remote
Joined January 2025
- Tweets2K
- Following795
- Followers284
- Likes4.1K








Pinned Tweet
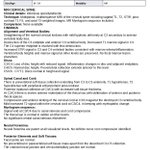
Before posting my video appeal, transparency comes first. Here is the official hospital report detailing my spinal condition & confirming the urgent need for a cervical corpectomy surgery.
Total needed: ₦17,055,000.
Donation details below 👇
#SaveSeunSamson #HelpSeunHeal


Weeks have passed, and I’m still battling severe pain from spinal compression. I’m deeply grateful for everyone who has supported me. 🙏❤️
Please help me get the surgery I urgently need.
GTBank: 0168003931
Oluwaseun Samson Ayomide
🌐 gofund.me/397a65180
#SaveSeunSamson

Please keep supporting Seun. My fight against severe spinal compression continues. I’m deeply grateful for every donation and share. 🙏❤️
Please help me regain my mobility.
🇳🇬 GTBank: 0168003931
Oluwaseun Samson Ayomide
🌍 gofund.me/397a65180
#SaveSeunSamson

We’ve raised ₦6.147M! ❤️🙏
Thank you to everyone who has donated, prayed & shared. Your support keeps me hopeful.
₦10.9M more is needed for my spinal surgery. Please help me reach the finish line.
GTBank: 0168003931
Oluwaseun Samson Ayomide
#SaveSeunSamson

My condition is getting more critical, and the pain is becoming unbearable. I urgently need a cervical corpectomy to relieve pressure on my spinal cord.
Please help me through this. 🙏❤️
GTBank: 0168003931
Oluwaseun Samson Ayomide
#SaveSeunSamson

I urgently need a cervical corpectomy surgery costing ₦17,055,000, covering implants, ICU care & rehabilitation.
Please help me get back on my feet. Any support or RT means so much. 🙏❤️
GTBank: 0168003931
Oluwaseun Samson Ayomide
#SupportOluwaseun #HelpSeunSamson

Please I urgently need your help to save my life. I’ve been diagnosed with a severe spinal condition requiring a cervical corpectomy surgery.
Goal: ₦17m
GTBank: 0618003931
Name: Oluwaseun Samson Ayomide
Please watch, RT & help me get back on my feet! 🙏❤️
#SaveSeunSamson


August is almost here ..
Stop thinking and send that dm today to book a slot.
Just starting out your data career or you want to get more knowledge? This is for you.

Our speaker @cheftee_lead 🥳

Meet @cheftee_lead , Certified Data Analyst, Data Analysis Instructor, and Co-Founder of Learnyx Africa.
She’ll be joining us at TDI Tech Summit 2.0 to share practical insights for anyone looking to grow in tech.
See you July 25! 🚀
#TDITechSummit

Are you just starting out your data analytics career?
Looking to upgrade your Excel skills?
This 5 weeks Excel training is for you.
Send a DM today to keep a seat for yourself.

Hii Data nerds!
Missed the last Excel101 training? Worry not
The next one is upon us. Send that dm today to secure a spot for yourself and get to transform your Excel skill.

I'm the assistant Lead Consultant 😎
Watch thud space !!! @frivikhq

1
5
270

In Excel101, this is the kind of work you get to learn how to build. It's not just about building, you get to learn the reason why this is important and what problem it solves for the business.
Send that dm today.
Every Monday morning, Aisha, the VP of Sales at a fast-growing B2B hardware company, joins the executive leadership meeting with the same question:
*"How healthy is our pipeline?"*
It sounds simple.
But getting the answer wasn't.
Sales data lived in different CSV files.
Account information sat in one report.
Product details lived in another.
Sales team records were maintained separately.
And the pipeline itself existed in a transactional export filled with typos, missing values, and incomplete deals still in progress.
The team wasn't struggling because they lacked data.
They were struggling because they lacked a single source of truth.
Without it, critical questions took hours to answer:
* Are discounts helping us win more deals?
* Which products generate the most revenue?
* How long does it take to close a deal?
* Which sales managers are outperforming their targets?
* Where are opportunities getting stuck in the pipeline?
To solve this, I built an end-to-end sales analytics solution in Excel using Power Query and Power Pivot.
The project started with four raw CSV files:
• Accounts
• Products
• Sales Teams
• Sales Pipeline
Using Power Query, I designed an ETL process to clean, standardize, and prepare the data for analysis.
This included:
* Correcting data inconsistencies and typos
* Preserving blank values that represented active opportunities
* Standardizing text fields and data types
* Replacing missing account values
* Creating a dedicated calendar table for time intelligence
Once transformed, the data was modeled into a Star Schema using Power Pivot.
Instead of working with one large spreadsheet, the solution separated transactional data from descriptive data using Fact and Dimension tables connected through relationships.
The model was then enriched with DAX calculations to answer key business questions, including:
* Total Revenue
* Win Rate
* Average Days to Close
* Average Discount Percentage
* Quarter-over-Quarter Growth
One of the most interesting insights came from the Agent Efficiency Matrix.
By comparing average discount percentages against win rates, we discovered that higher discounts had little impact on deal success.
The assumption that "bigger discounts close more deals" simply wasn't supported by the data.
The final dashboard provides executives with a single, interactive view of sales performance through:
• Revenue and pipeline KPIs
• Funnel analysis of deal stages
• Product performance rankings
• Agent efficiency analysis
• Dynamic quarter and manager filters
• Automated narrative insights that update based on user selections
What used to take multiple files and hours of manual reporting can now be answered in seconds.
Because effective analytics isn't about building more charts.
It's about connecting data, asking better questions, and creating systems that help people make decisions faster.
**Tools Used:** Excel, Power Query, Power Pivot, DAX, PivotTables, PivotCharts, Slicers
#DataAnalytics #Excel #Powerquery

Week 4 of Excel101 was an interesting one.
Week 5 starts tomorrow, and it's going to be more interesting
Week 4 of EXCEL101 was the week students stopped cleaning data manually and started building systems.
Up until now, we had been working with datasets that were already structured enough to analyze.
This week introduced a different reality:
Data rarely arrives analysis-ready.
It comes from different files, different teams, different systems, and often in different formats.
That's why we spent the week learning "Power Query" — Excel's built-in data transformation engine.
And once students saw what it could do, the conversation changed.
We started with the concept of ETL:
Extract – Bring data in from external sources.
Transform – Clean, standardize, reshape, and enrich the data.
Load – Push the refined dataset into Excel for reporting and analysis.
The most important lesson wasn't the buttons.
It was understanding that Power Query doesn't change your original data.
Every transformation becomes a recorded step.
Fix it once.
Refresh forever.
That's a completely different way of working.
For the practical session, students worked with multiple CSV files based on regional sales data.
The datasets were intentionally messy.
Different date formats.
Inconsistent name formats.
Extra spaces.
Blank rows.
The kind of problems analysts deal with every day.
Step by step, students learned how to:
* Remove blank rows
* Fix incorrect data types
* Standardize text fields
* Create calculated columns
* Generate date-based attributes
* Load clean datasets back into Excel
The highlight for many students was "Appending".
Instead of manually copying and pasting multiple reports into one sheet, they combined separate datasets into a single master table using Power Query.
More importantly, they learned the principle behind it:
Automation only works when structure is respected.
If column names, formats, and data types are inconsistent, automation breaks.
If the structure is right, the process scales.
From there, we moved into "Data Modeling concepts".
Students were introduced to Fact and Dimension tables and the idea that not all data belongs in one giant spreadsheet.
We discussed:
* Fact Tables (transactions and measurable events)
* Dimension Tables (descriptive information)
* Primary Keys
* Foreign Keys
These concepts laid the foundation for one of the most important topics of the week:
Merge.
Many students initially saw Merge as another lookup feature.
By the end of the session, they understood that it is much more than that.
Append adds rows.
Merge adds context.
Append is vertical.
Merge is relational.
We explored different join types and discussed why choosing the wrong join can change the results of an analysis without generating an error.
That insight alone was worth the session.
Then came the assignment.
Students received data from a fictional logistics company containing shipment transactions, customer information, route details, and driver records.
Their task was to:
* Clean and standardize the shipment data
* Merge multiple dimension tables into the fact table
* Create new calculated fields
* Build KPI summaries
* Develop PivotTable reports and charts
* Answer business questions using the transformed dataset
The objective wasn't simply to build reports.
It was to create a repeatable workflow that could handle changing data.
That's what analysts do.
They don't just analyze data.
They design processes that make analysis possible.
Week 4 introduced that mindset.
And with Power Query now in place, students are beginning to see Excel as more than a spreadsheet application.
They're starting to see it as a complete data transformation and reporting platform.
Next up: Power Pivot, Data Modeling, DAX, and KPI Reporting.


Excel101 week 3 concluded.
Week 4 commences on Saturday.
It's still not too late to get involved. Recordings to previous classes are available.
Send a dm today.
Week 3 of EXCEL101 was where students began thinking less like spreadsheet users and more like analysts.
Before touching PivotTables, we focused on something more important: asking the right questions.
Because analysis doesn't start with charts or reports. It starts with understanding what problem you're trying to solve and what answer you're looking for.
From there, we explored PivotTables in depth.
@Lima_D_Analyst kicked off the class on Saturday
Students learned how to:
* Build PivotTables from scratch
* Use Rows, Columns, Values, and Filters effectively
* Group dates by Month, Quarter, and Year
* Calculate Running Totals and Percentage of Total
* Create Calculated Fields
* Manage multiple PivotTables from a single data source
The goal wasn't just summarizing data. It was learning how to turn large datasets into meaningful insights.
We then moved into PivotCharts and dashboard design.
We discussed how different visuals answer different questions and why effective dashboards focus on clarity rather than complexity.
Topics covered included:
* Bar, Line, Donut, and Clustered Bar Charts
* KPI Cards
* Visual Hierarchy
* Dashboard Layout
* Report Storytelling
One of the highlights of the week was introducing Slicers and Timelines.
Students learned how to connect a single filter to multiple PivotTables, allowing entire dashboards to update instantly with a few clicks.
That was the moment many began to see Excel as more than a spreadsheet tool. It became a reporting system.
This week's assignment, designed and reviewed by @TheBoyAnalyst, involved a Retail Sales Data Workshop containing:
* 1,200 sales records
* 10 stores
* 12 products
* Multiple worksheets
Students were required to:
* Clean the dataset
* Enrich missing information using XLOOKUP
* Create performance metrics with IF and IFS
* Build a dashboard powered by five PivotTables
The final dashboard had to answer key business questions around:
* Store revenue performance
* Monthly sales trends
* Product category performance
* Payment method distribution
* Regional channel performance
The submissions demonstrated strong growth. The dashboards were structured, interactive, and focused on answering business questions rather than simply displaying numbers.
The final deliverable for Week 3 was a fully interactive dashboard capable of exploring data through slicers, visualizations, and dynamic reporting.
Next up: Power Query, ETL, and Descriptive Statistics.


1
82
Week 2 of Excel101 is done.
The assignment was an interesting one 😊
Week 2 of EXCEL101 is done… and this was the week the class started thinking differently about data.
Week 1 gave us the foundation.
Week 2 introduced something more important:
The idea that analysts don’t “fix data manually.”
They build systems that clean, structure, and automate the work for them.
That mindset shift changed the atmosphere in the room almost immediately.
We opened with one principle:
"GIGO — Garbage In, Garbage Out."
It didn’t matter how beautiful a dashboard looked or how advanced a formula was.
If the underlying data was dirty, inconsistent, or poorly structured, the analysis would always be unreliable.
And honestly, that realization hit a lot of people hard 😂
Because most spreadsheet frustration doesn’t come from Excel “misbehaving.”
It comes from bad data.
So this week became all about control.
We explored text cleaning functions:
TRIM, CLEAN, SUBSTITUTE, PROPER, UPPER, LOWER, LEFT, RIGHT, MID, LEN, CONCAT, TEXTJOIN…
…and for the first time, students started seeing Excel less as a calculator and more as a transformation tool.
One of my favourite moments was introducing function nesting.
Watching:
=PROPER(TRIM(CLEAN(A2)))
go from “confusing formula” to “wait… this is actually genius” was satisfying to watch.
Because that’s when people begin understanding that formulas are not isolated tools.
They can work together.
And once you understand that, Excel becomes significantly more powerful.
We also spent time on:
📌 Aggregate Functions — SUM, AVERAGE, MIN, MAX, COUNT, COUNTA
📌 Conditional Aggregates — SUMIFS, COUNTIFS, AVERAGEIF
📌 Ranking Functions — LARGE, SMALL, RANK
📌 Logical Functions — IF, Nested IF, AND, OR, IFS
📌 Lookup Functions — VLOOKUP, XLOOKUP, INDEX+MATCH
The Lookup session especially changed the energy in the room.
Because once people realize they no longer need to manually search through tables or repeatedly type the same information…
…there’s no going back.
Then came the assignment.
This week’s challenge came from @TheBoyAnalyst
A Banking Loan Data Cleaning & Analysis task involving 300 rows of dirty loan data spread across 3 tables:
LOANS, OFFICER, and PRODUCT.
Students had to:
✔ Clean the LOANS dataset
✔ Standardize the structure
✔ Use XLOOKUP to retrieve officer and product details
✔ Automate calculations instead of manually typing values
And this part mattered most:
An analyst never types what already exists in a table.
That sentence alone summarizes half of data analysis.
Corrections have already been reviewed and returned — and honestly, the quality of submissions this week showed growth.
The deliverable at the end of Week 2:
A fully cleaned dataset and automated calculation sheets with minimal manual intervention.
That’s real progress.
Next up:
📊 PivotTables
📈 Dashboards
📉 Descriptive Statistics
Week 3 is where the datasets start talking back.


1
84
Excel101 Week 1 done.
Week 2 is on tomorrow.
You can still join in. It's not too late.
It’s a new season of EXCEL101 and Week 1 just wrapped up.
And honestly? This cohort came ready.
We started from the foundations:
Workbook vs Worksheet, the Excel grid, Ribbon, Name Box, Formula Bar — the kind of things many people skip because they “already know Excel.”
But foundations matter.
One of the biggest moments this week was watching students realise the difference between:
*what a cell displays
* and what the Formula Bar actually contains.
That tiny distinction alone explains a lot of spreadsheet confusion people struggle with for years.
We also explored:
Data Types, Cell References, Navigation Shortcuts, AutoFill & Flash Fill, Number Formatting, Data Validation, Conditional Formatting, Freeze Panes and Workbook Organisation
Cell references especially decided to bring that to the first week
Understanding the difference between:
=A1
=A$1
=$A$1
…is one of those concepts that separates someone who *uses* Excel from someone who actually *understands* Excel.
We also had a really good conversation comparing Excel vs Google Sheets, not from a “which is better?” perspective, but from a workflow perspective.
A lot of students were surprised to see that the skills transfer directly across both platforms, especially those working in Google Workspace environments.
Then came the assignment and Wednesday Class
By @TheBoyAnalyst
🛒 **Retail Inventory & Sales Tracker**
Students had to:
* Build a tracker from scratch
* Apply Data Validation
* Use Conditional Formatting
* Apply formulas
* Submit in both Excel and Google Sheets
* Write a short report explaining their process
Because building something is one skill.
Explaining your process clearly is another.


