

Interesting questions, explored through data. Charts and analysis on society, economics, politics, science, and the environment.
Switzerland
Joined November 2022
- Tweets3.1K
- Following280
- Followers174
- Likes1.1K




🇨🇭 Die Nettozuwanderung in die Schweiz hat sich in den letzten 55 Jahren stark verändert.
1975: −57’847, als die Rezession nach der Ölkrise zu massiven Arbeitsplatzverlusten und zur Abwanderung vieler ausländischer Arbeitskräfte führte.
2008: +98’167, begünstigt durch eine starke Nachfrage nach Arbeitskräften und die Aufhebung der Kontingente für viele EU-/EFTA-Staatsangehörige im Jahr 2007.
2023: Rekordwert von +139’118, teilweise bedingt durch Geflüchtete aus der Ukraine, die bereits 2022 eingereist waren, aber erst ein Jahr später in die Statistik der ständigen Wohnbevölkerung aufgenommen wurden.
2025: +70’432, fast eine Halbierung gegenüber dem Höchststand von 2023.
Die Grafik zeigt die gesamte Entwicklung von 1971 bis 2025, basierend auf Daten des Bundesamts für Statistik (BFS).
Quellen und Methodik: mtsinganis.github.io/the-dat…

🇨🇭Switzerland's net migration has changed dramatically over the past 55 years.
1975: −57,847, as the oil-crisis recession led to widespread job losses and departures of foreign workers.
2008: +98,167, amid strong labour demand and the lifting of quotas for many EU/EFTA workers in 2007.
2023: A record +139,118, partly reflecting Ukrainian refugees who arrived in 2022 but entered permanent-resident statistics a year later.
2025: +70,432, nearly half the 2023 peak.
Here's the full picture from 1971 to 2025, based on Swiss Federal Statistical Office data.
Sources & Methodology: mtsinganis.github.io/the-dat…

One of the more interesting consequences of China's industrialization was what it meant for Australia's economy.
Since 1995, China climbed from 42nd to 10th in economic complexity, while Australia fell from 33rd to 73rd.
These two developments were connected.
As China's manufacturing expanded, so did its demand for Australian iron ore and coal. This helped fuel Australia's mining boom, reinforcing its specialization in natural resources.
China moved into increasingly sophisticated manufacturing, while Australia's goods exports became more commodity-intensive.
In other words, the same industrial transformation that helped propel China up the rankings also contributed to the forces behind Australia's relative decline.

But China wasn't alone.
Vietnam climbed from 119th to 44th, and the Philippines from 69th to 38th. Both also overtook Australia.
Their rise reflects growing participation in electronics and manufacturing supply chains, part of a broader shift in the composition of Asian exports.
Economic complexity measures the diversity and sophistication of goods exports, not national wealth. It should also be noted that a country's ranking reflects its performance relative to other countries, not just changes in its own economic complexity.
Source: Harvard Growth Lab, 1995–2024.

This chart perfectly illustrates how reliant Australia's economy has been on its iron ore exports to China over the past decades.
About 60% of the country's exports are natural resources.
In my latest chart, you can see how Australia's increasing reliance on these exports has resulted in a decreasing economic complexity that perfectly mirrors China's rise in the rankings.
xitter.gq/TheDataDecoded/status/…

.
An incredible $67 billion in export revenue!
Australia mines the iron ore. China turns it into steel.
Australia's exports to China were worth US$66.93 billion in 2025. The figures for Nigeria, Greece, and Morocco represent their total goods exports in the same year, excluding services.
Australia's iron ore exports have grown enormously since 1990. But most of this growth has depended on one buyer: China.
The 2025 figures tell the story
o0o Australia exported around 923 million tonnes of iron ore worldwide.
o0o Around 800 million tonnes went to China.
o0o China accounted for roughly 86% of Australia's iron ore exports by volume.
Why doesn't Australia process more of its iron ore into steel?
Australia has large iron ore deposits, but steelmaking requires huge investments, reliable energy supplies and large industrial facilities. China already has a much larger steel industry, established supply chains and a huge domestic market.
Australia does produce steel, but exporting iron ore has been its main business.
This trade relationship benefits both countries. It also leaves Australia highly dependent on China's steel demand.
Sources: @ieefa_institute


🇩🇪
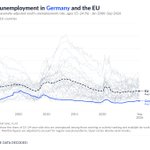
Germany’s youth unemployment since 2000, compared with the EU-27 rate.
The blue line shows Germany; the dashed line shows the EU rate. Grey lines show the other EU countries.
Germany has consistently recorded one of the EU’s lowest youth unemployment rates in recent years. The OECD credits its apprenticeship system, combining classroom learning with paid workplace training, with helping keep the rate low.
Source: Eurostat

🇫🇷
France’s youth unemployment since 2000, compared with the EU-27 rate.
The blue line shows France; the dashed line shows the EU rate. Grey lines show the other EU countries.
France has expanded support for apprenticeships since 2018 to help young people move from education into work. Yet youth unemployment remains above the EU-27 rate, showing that the challenge extends beyond access to training.
Source: Eurostat

🇫🇮
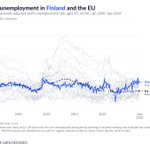
Finland’s youth unemployment since 2000, compared with the EU-27 rate.
The blue line shows Finland; the dashed line shows the EU rate. Grey lines show the other EU countries.
Youth unemployment has climbed sharply in recent years, against a backdrop of economic weakness and a prolonged construction downturn.
Source: Eurostat

🇪🇪
Estonia’s youth unemployment since 2000, compared with the EU-27 rate.
The blue line shows Estonia; the dashed line shows the EU rate. Other EU countries appear in grey.
The financial crisis hit young Estonians particularly hard: youth unemployment reached roughly one in three in 2010, before falling substantially during the recovery.
Source: Eurostat

🇩🇰
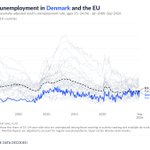
Denmark’s youth unemployment since 2000, compared with the EU-27 rate.
The blue line shows Denmark; the dashed line shows the EU rate. Other EU countries appear in grey.
Source: Eurostat

Czechia’s youth unemployment since 2000, compared with the EU-27 rate.
The blue line shows Czechia; the dashed line shows the EU rate. Grey lines show the other EU countries.
Czechia’s youth unemployment has remained below the EU-27 rate for much of the past two decades, though young jobseekers have still faced sharp setbacks during economic downturns. The OECD highlights a mismatch between training and jobs: up to 40% of recently employed vocational graduates work outside their field of study.
Source: Eurostat

Italy exhibits a striking pattern of extreme wetness and dryness across years, but even across different parts of its territory within a given year.

🇨🇾
Cyprus’s youth unemployment since 2000, compared with the EU-27 rate.
The blue line shows Cyprus; the dashed line shows the EU rate. Grey lines show the other EU countries.
Cyprus has one of the EU’s highest shares of university-educated young adults, yet the European Commission reports that recent tertiary graduates have a lower employment rate than vocational graduates, a sign that qualifications do not always match available jobs.
Source: Eurostat

The ultimate visual guide to a typical day of passenger trains in Switzerland 🇨🇭. Top notch work by @milos_gis. Send it to your Swiss friends!
🇭🇷
Croatia’s youth unemployment since 2000, compared with the EU-27 rate.
The blue line shows Croatia; the dashed line shows the EU rate. Grey lines show the other EU countries.
The OECD points to limited workplace training and outdated vocational curricula as obstacles to young Croatians finding jobs, even as employers face skills shortages.
Source: Eurostat (quarterly data).

🇧🇬
Bulgaria’s youth unemployment since 2000, compared with the EU-27 rate.
The blue line shows Bulgaria; the dashed line shows the EU rate. Grey lines show the other EU countries.
Beyond unemployment, the OECD highlights a further challenge: young people with little formal education remain particularly likely to be outside both work and education.
Source: Eurostat

🇧🇪
Belgium’s youth unemployment since 2000, compared with the EU-27 rate.
The blue line shows Belgium; the dashed line shows the EU rate. Grey lines show the other EU countries.
The OECD has highlighted difficulties in moving from school into work, particularly for disadvantaged young people.
Source: Eurostat (quarterly data)
