VeeBeeMapStats (@VeeBeeMapStats) header
VeeBeeMapStats (@VeeBeeMapStats) profile picture

Making complex data easy to understand by turning dry statistics into clear, beautiful charts.

Joined September 2026
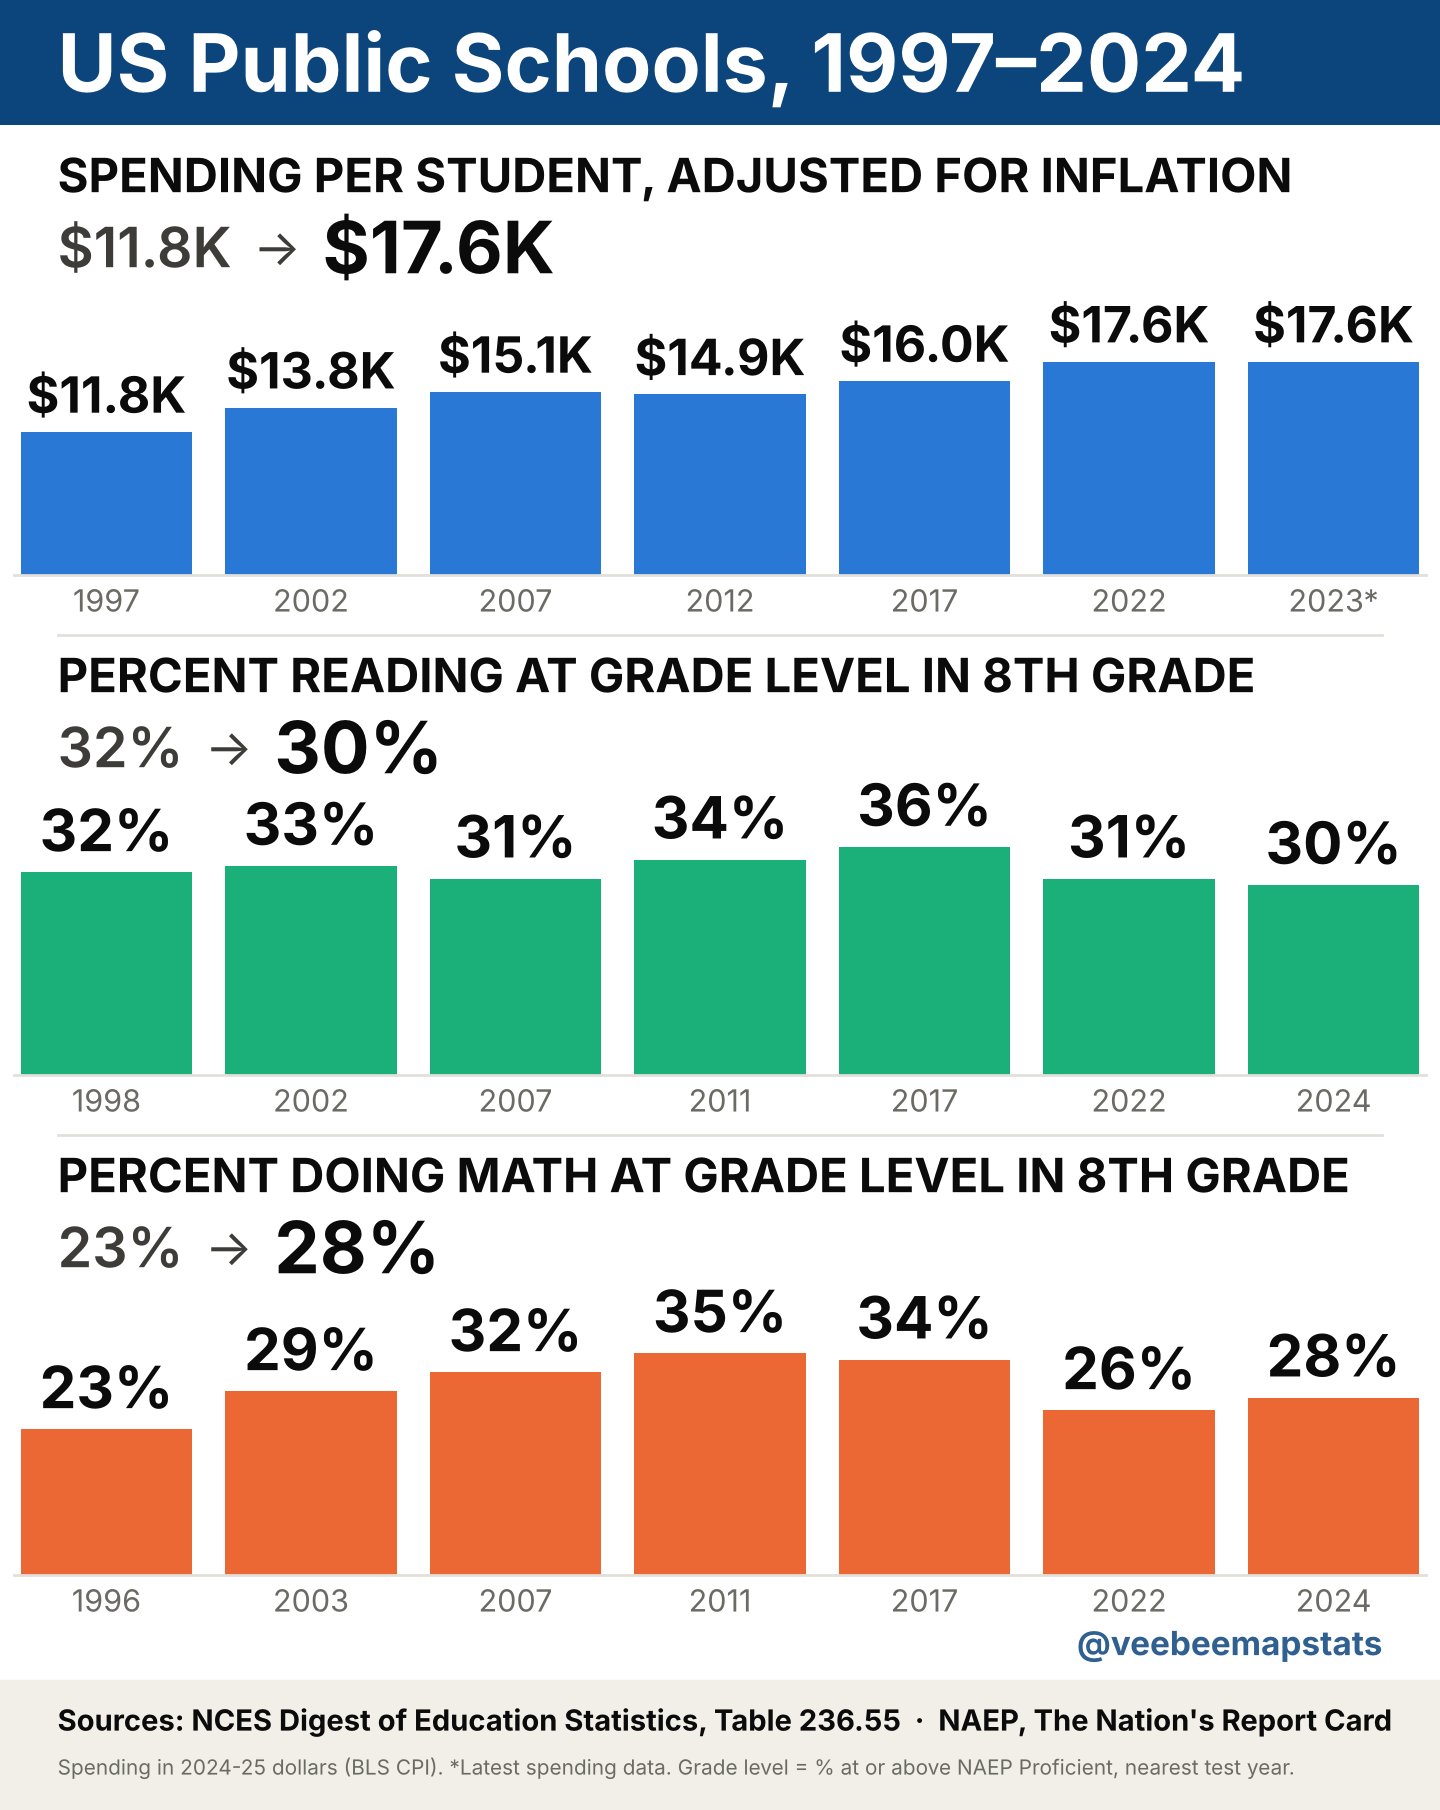
To increase education scores in the US, do we need more money or something else?
1
1
1
40
Crash statistics in the US by sex.
1
1
1
14
Despite the rising cost of houses, around 65% of Americans own their home. Average USA home price, size, & ownership graphed below.
1
2
1
1
139
Who is the better driver? Hint: it's not looking good for the guys. #caraccidentsbysex #caraccidentsbyage #caraccidents
1
1
24
Automobile crash risk by age graphed out. THIS is the reason why it's so expensive to add your teenager to your car insurance. #autoinsurancebyage
1
1
1
92
The price of oil per barrel graphed out for Jan - Oct 2026. WTI (West Texas Intermediate).
1
1
1
72
After Roe v. Wade was overturned, this is what happened to abortion limits in each state.
1
1
147
The percentage of dog and cat ownership in the United States on a visual map:
2
2
64
Estimated casualties from the Russia and Ukraine war since it started in February 2022:
5
2
1
2
762
Average credit card debt amount per state in the US in 2026:
2
2
47
Bar graph of how many MBPD (millions of barrels per day) are getting through the Straight of Hormuz. #costofoil #StraightOfHormuz
2
1
2
388
Simple graph of the cost of oil per barrel for 2026 year to date.
1
2
1
2
927
STD Rates: each state in the US mapped out by the number of people with an STD per 100K residents
2
1
2
297
Bar graph showing that since 2024, women have gained 765K jobs, but men have lost 6K jobs.
2
2
2
193
Bar graph of number of positions open for senior-level work in 2019 vs. 2026. Apparently, it pays to have experience.
2
1
1
165
Entry-level job comparison between 2019 and 2026. Most sectors have fewer entry-level jobs.
3
1
5
3,315
Price of Oil (Texas WTI) vs. Monthly US Inflation Graph to Create Correlation of Oil Price & US Inflation
2
1
2
649
The birth rate (TFR) per state in the USA visually mapped:
2
2
27
Every state is below the 2.1 replacement level.
2
1
2
34