VeeBeeMapStats (@VeeBeeMapStats) header
VeeBeeMapStats (@VeeBeeMapStats) profile picture

Making complex data easy to understand by turning dry statistics into clear, beautiful charts.

Joined September 2026
Photo by VeeBeeMapStats (@VeeBeeMapStats)Photo by VeeBeeMapStats (@VeeBeeMapStats)Photo by VeeBeeMapStats (@VeeBeeMapStats)Photo by VeeBeeMapStats (@VeeBeeMapStats)Photo by VeeBeeMapStats (@VeeBeeMapStats)Photo by VeeBeeMapStats (@VeeBeeMapStats)Photo by VeeBeeMapStats (@VeeBeeMapStats)Photo by VeeBeeMapStats (@VeeBeeMapStats)Photo by VeeBeeMapStats (@VeeBeeMapStats)Photo by VeeBeeMapStats (@VeeBeeMapStats)
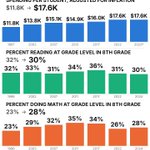
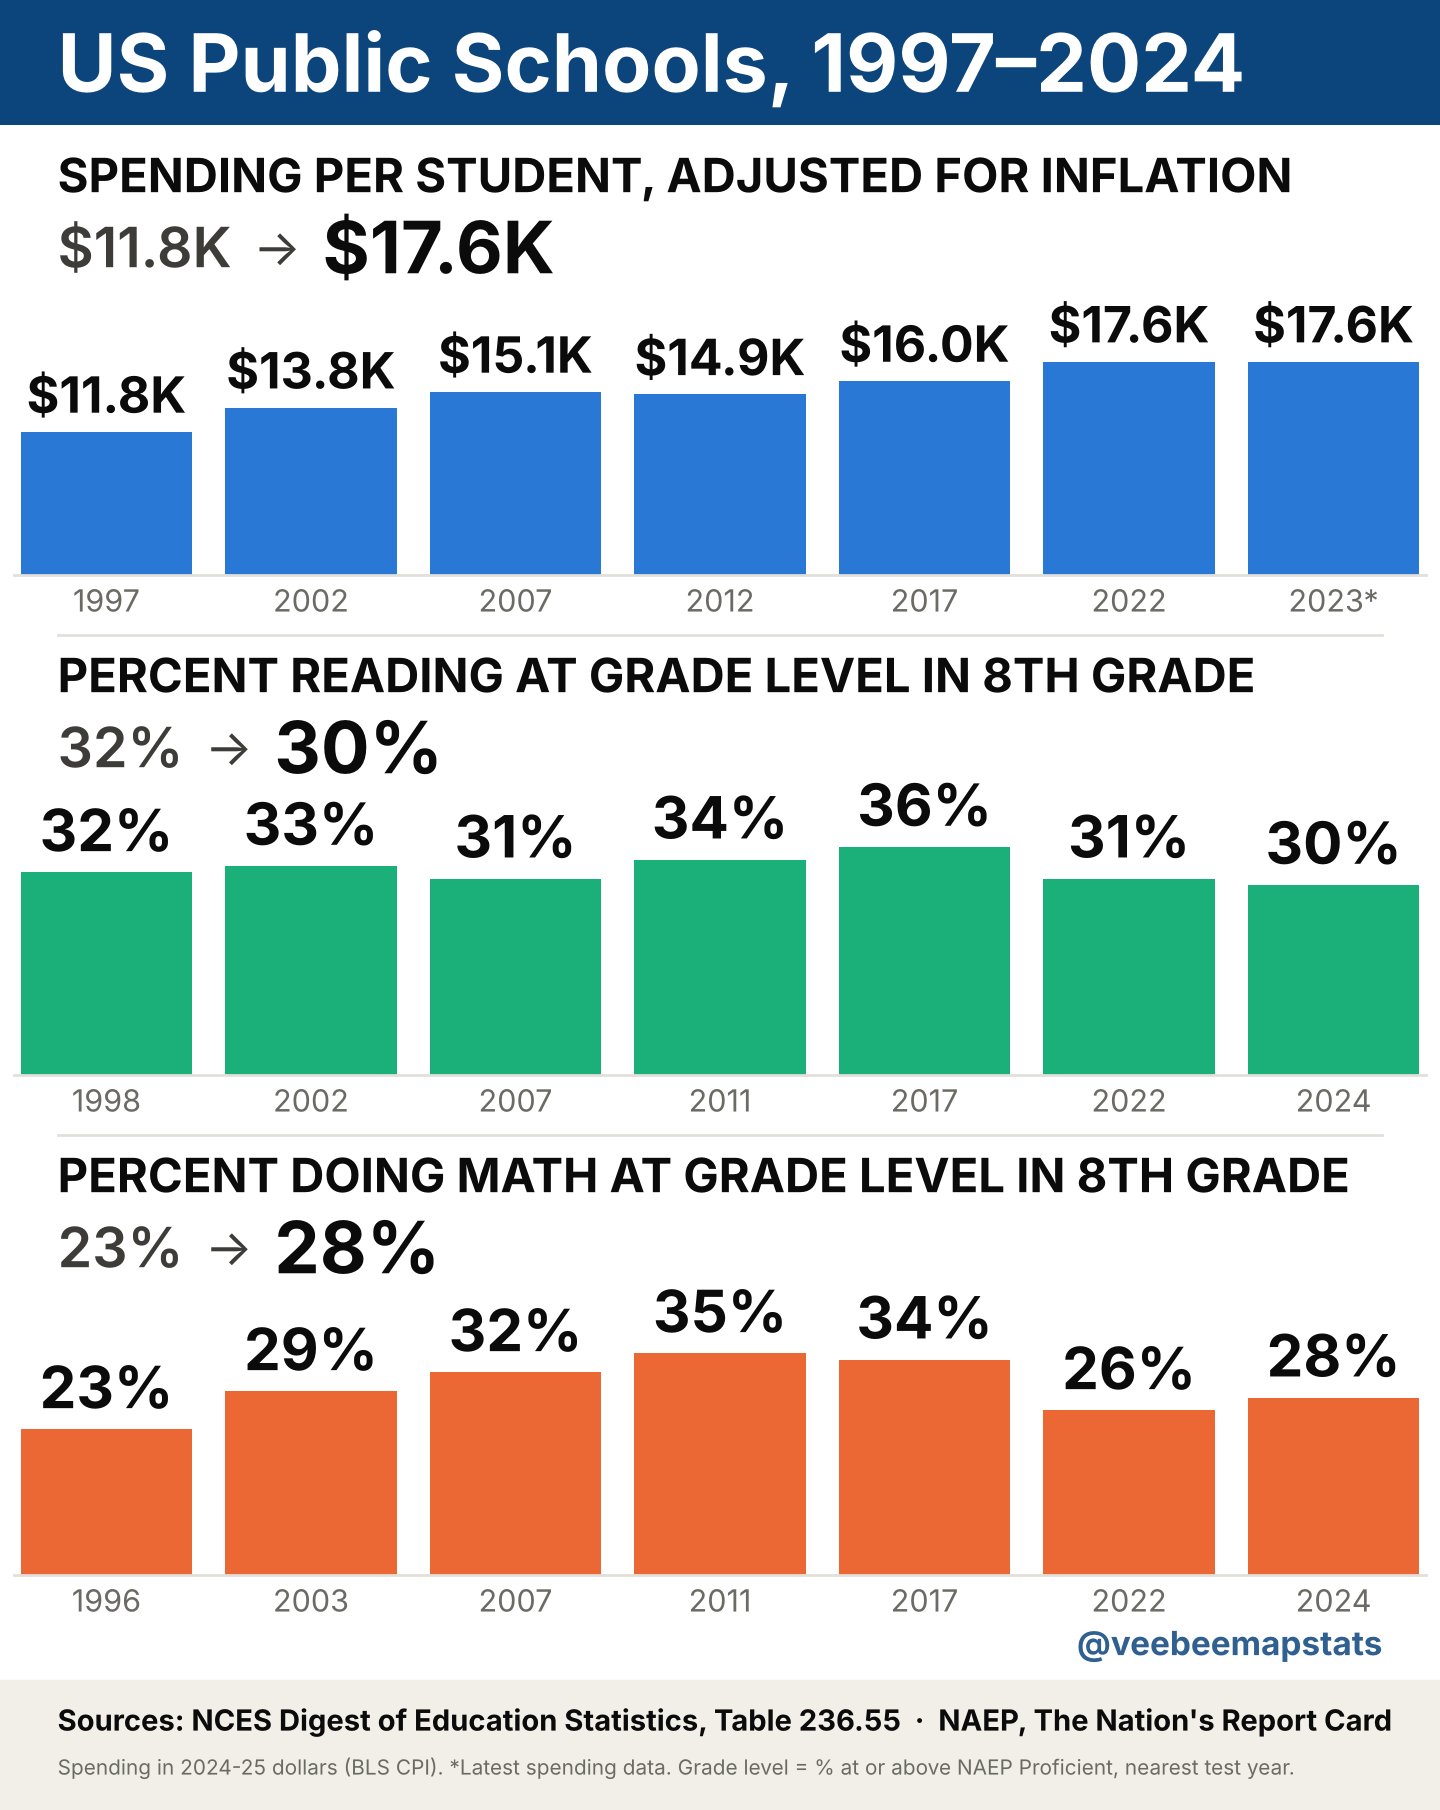
To increase education scores in the US, do we need more money or something else?
1
1
1
40
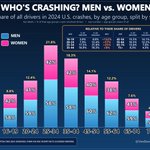
Crash statistics in the US by sex.
1
1
1
14
Replying to @TeamTrick2
Thanks for the feedback!
1
4
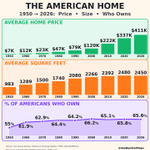
Despite the rising cost of houses, around 65% of Americans own their home. Average USA home price, size, & ownership graphed below.
1
2
1
1
139
Who is the better driver? Hint: it's not looking good for the guys. #caraccidentsbysex #caraccidentsbyage #caraccidents
1
1
24
Automobile crash risk by age graphed out. THIS is the reason why it's so expensive to add your teenager to your car insurance. #autoinsurancebyage
1
1
1
92
The price of oil per barrel graphed out for Jan - Oct 2026. WTI (West Texas Intermediate).
1
1
1
72
After Roe v. Wade was overturned, this is what happened to abortion limits in each state.
1
1
147
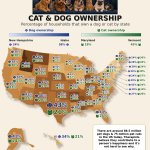
The percentage of dog and cat ownership in the United States on a visual map:
2
2
64
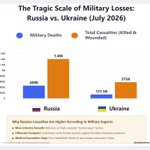
Estimated casualties from the Russia and Ukraine war since it started in February 2022:
5
2
1
2
762
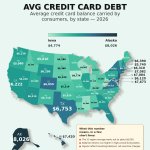
Average credit card debt amount per state in the US in 2026:
2
2
47
Bar graph of how many MBPD (millions of barrels per day) are getting through the Straight of Hormuz. #costofoil #StraightOfHormuz
2
1
2
388
Simple graph of the cost of oil per barrel for 2026 year to date.
1
2
1
2
927
STD Rates: each state in the US mapped out by the number of people with an STD per 100K residents
2
1
2
297
Replying to @RapidResponse47
Bar graph showing that since 2024, women have gained 765K jobs, but men have lost 6K jobs.
1
Replying to @MattWalshBlog
Bar graph showing that since 2024, women have gained 765K jobs, but men have lost 6K jobs.
1
Bar graph showing that since 2024, women have gained 765K jobs, but men have lost 6K jobs.
2
2
2
193
Bar graph of number of positions open for senior-level work in 2019 vs. 2026. Apparently, it pays to have experience.
2
1
1
165
Entry-level job comparison between 2019 and 2026. Most sectors have fewer entry-level jobs.
3
1
5
3,315
Price of Oil (Texas WTI) vs. Monthly US Inflation Graph to Create Correlation of Oil Price & US Inflation
2
1
2
649