



Pinned Tweet
📢 Final edition of OECD's « Fiscal Federalism 2022 » out today!📕
👉🏼 You'll find the latest on the impacts of the crisis, for state & local finances 📉💰💸📈
👉🏼 Good practices in all areas of intergovernmental fiscal relations 💫🏃♀️⚖️💭
💸eBook version: oe.cd/il/FiscalFederalism🧵

Sean Dougherty 🌍 retweeted

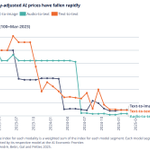
As AI labs race toward Recursive Self Improvement, there’s a possibility that what they are actually racing toward is Recursive Self Extinction — of their business model. Here’s my reasoning.
1. Progress on verifiable tasks continues. In particular, improving the cost efficiency of existing capabilities is a highly verifiable task. For the past few years, cost per equivalent capability has dropped by at least 10x per year. I think this progress will be sustained for a few more years, and even accelerate as labs use AI more and more heavily for AI research in the pursuit of RSI. There is of course a ceiling to efficiency improvements, but I don’t think we’re close to that ceiling.
2. Progress on most unverifiable tasks remains frustratingly hard. AI inherits the same limitations (ambiguous success criteria, slow and noisy feedback) that limit human performance at tasks ranging from writing to governance. The optimization paradigm generally doesn’t result in superhuman capabilities on such tasks, because whatever proxy you optimize for gets Goodharted. For example, I recently pointed out how over-optimization explains Claude’s overly dense and ornamental writing style that’s since been dialed back.
3. RSI ends up being narrow. A consequence of the above two points — even if some version of RSI is achieved, it results in an explosion in some dimensions (efficiency, verifiable tasks) while falling short of producing something that is superintelligent in any real sense or capable of automating a broad swath of jobs in the economy.
4. More than one lab stays at the frontier. This means the market will remain competitive, and developers can’t charge high margins to compensate for rapidly falling inference prices. Any compute scarcity that allows higher margins is temporary, in my view. I also think it’s likely that most of the innovations continue to make their way into open-weight models with some lag, so open-weight models are at cost parity for inference or only slightly more expensive. Note that efficiency tricks and verifiable capabilities tend to leak much faster than unverifiable ones. Distillation could be one reason, but simply knowing that something can be sped up 10x tends to have a focusing effect on research and innovation.
5. Jevons’ paradox is not a magic bullet. If the above points hold, there are very few applications that will consume so many tokens that they could generate the astronomical amounts of revenue implied by the labs’ valuations. We’re talking about a 10x growth in tokens year after year, just to keep revenue flat given falling prices.
Even today’s behemoth tasks like migration of million-line legacy codebases will likely become cheap within a few years. While new applications will open up, there won’t be orders of magnitude more new ones. As for unverifiable tasks, inference scaling rapidly hits diminishing returns. Ultimately you have to have a human in the loop who’s accountable for the result. Spending more on tokens doesn’t let customers escape that responsibility — and only makes the human review bottleneck worse.
6. What about scientific research? Science is an endless frontier, and more tokens could perpetually mean more discoveries and inventions, in theory. But the unfortunate thing about research is that researchers don’t get to capture the value it creates, which is why it requires government funding in the first place. Even if it’s true that AI could enable great scientific innovations, I don’t think AI companies will make much money off of that. I think they are currently investing in AI-for-science not as a future revenue stream but as a loss leader because they want to show the public that it could be beneficial to humanity.
7. The one escape hatch is moving “up the stack”, by which I mean quickly transitioning from selling tokens to an enterprise software like model that relies on high switching costs, deep integration into workflows, and control over systems of record. In this world, enterprises will purchase “digital workers” or pay per solution (e.g. resolved support ticket) rather than tokens, so it’s good or neutral for AI companies if inference costs fall. And open models don’t matter as much — Linux being free didn’t make most enterprises switch away from Windows, because they paid for polish, peace of mind, support, and familiarity, not the code itself. I think this is the labs’ best bet for becoming sustainable businesses (though the potential lock-in is concerning for their customers!). The problem is that the labs have many hurdles to clear to get there, most of all their mindset, and the faster they race toward RSI, the shorter the window they give themselves for this transition. The pure-play AI labs are the ones who are farthest from being able to make this transition, and AI companies with a long history in enterprise software are relatively well positioned.
In short, the race to RSI ends up being a race to eliminate the labs’ main avenue for capturing the value that they create — the fate of many past transformative technologies such as railroads, airlines, and fiber.
The labs’ bet is that RSI produces a durable, decisive lead that escapes commoditization. My view is that there are two different improvement loops that have been conflated, and they will come apart. The efficiency improvement loop will accelerate, but a broader improvement loop that might lead to AGI or superintelligence will require ever-increasing amounts of compute, talent, data, and real-world feedback that can only come from gradual deployment, and the money to fund all this will have to come from massive revenue growth. And the irony is that the first improvement loop is undermining exactly that revenue growth.
The premise in my chain of reasoning that I’m least confident in is #5 — that Jevons’ paradox will eventually stop being able to compensate for efficiency improvements. A few months ago I was much more of a believer in continued, nearly unbounded token volume growth, but the more I’ve thought about it the more skeptical I’ve become.
To better understand why the premises and outcome I've laid out are at least a possibility:
* My AI-as-normal-technology essay and follow-up writings with @sayashk on our newsletter normaltech.ai/
* My ICML talk laying out my skepticism of the claim that RSI will lead to superintelligence normaltech.ai/p/what-will-be…
* Ramez Naam’s review of the evidence questioning the prospects of an intelligence explosion (@ramez) noahpinion.blog/p/wheres-the…
* My piece with Akash Kapur (@akashkapur) on whether AI labs will move up the stack normaltech.ai/p/up-the-stack…
* Many pieces by Nathan Lambert (@natolambert) such as “I expect rapid progress but not towards general superintelligence.”

Sean Dougherty 🌍 retweeted

I've been in France since 2002 and have never seen the streets so violent nor the politics so extreme. From the sacking of the supermarket on my street to the prospect of Présidente Le Pen, here's me @FT including thoughts from 2 French Nobel laureates as.ft.com/r/addcad57-0f9d-4e…

Sean Dougherty 🌍 retweeted

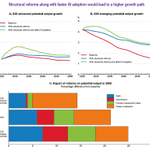
🔭 Why this matters: AI may make the economy far more productive while changing much of today's work, unevenly across occupations. Yet estimates span orders of magnitude and are hard to compare.
We restate the debate as differences in a few parameters: anthropic.com/institute/econ…

Sean Dougherty 🌍 retweeted

The timing of the paper could unfortunately not be better, given the evolution of the spread on French bonds…
The central mechanism in the paper: The strength of the effect of the subjective probability of default on the actual probability of default.
The main implication, put roughly: spreads can jump a lot in response to even small bad news about the likely evolution of debt.
The other implication, nerdier, and more paradoxical: Higher macro of fiscal uncertainty weakens the effect of the subjective probability on the actual probability and makes jumps and multiple equilibria less likely.
@GonHuertas gives a more precise, visually beautiful, explanation. Look at it.
I shall use the occasion however to reflect on something else, namely the frustration and the pleasure in doing research. This paper was started six years ago… At the time, it looked like a straightforward challenge: Characterize the solution to a simple, although nonlinear, equation: The evolution of debt depends on the interest rate, which depends on the risk of default, and thus in turn on the evolution of debt.
For much of the six years, I banged my head against the wall, thinking I had the solution until it collapsed, trying again and again. The project became known at home as "the wall". Then, @GonHuertas who was my RA at the time, and @Pmbruera, then an MIT student, took pity on me and came to the rescue. And we did succeed.
Frustration, then elation. This is why I have loved doing research for the last N years.

When public debt grows, default risk can jump suddenly.
Our new paper with @ojblanchard1 and @pmbruera finds that higher fiscal uncertainty reduces (!) the range of debt levels where self-fulfilling defaults can happen.
It's been years in the making.
nber.org/papers/w35850
Sean Dougherty 🌍 retweeted

Why I Changed My Mind About AI Risk open.substack.com/pub/persua…

Sean Dougherty 🌍 retweeted

WORRYING TRENDS IN PISA SCORES
The latest PISA (Programme for International Student Assessment) results are out.
PISA is a landmark program and the most comprehensive assessment of students across the word and its results provide invaluable information about the trends and performance of national education systems.
The latest global results are not very encouraging: after the steep decline in student performance in 2022, which took place during the pandemic, there is yet another large decline in scores in most countries (see the graphs below).
The largest decline in performance occurred in Reading. Perhaps not too surprising, given that “digital distractions” became all pervasive.
As Andreas Schleicher (director of the OECD Education directorate) mentions: “A large share of students struggled on reading tasks involving longer texts, requiring higher-order cognitive skills… At the same time, all students are more likely to “read in haste”, at least some of the time.”
Remember: these trends are happening for several years, preceded the pandemic, and, of course, the advent and diffusion of Artificial Intelligence.
If nothing is done, AI will likely reinforce these trends, even though students might obtain better results when they can use AI tools in their exams.
These are trends that should worry us all and are a call for action for policymakers. The next few years will be crucial to revert these worrying trends.
@OECD
@OECDEduSkills
@SchleicherOECD


Sean Dougherty 🌍 retweeted

A common AI scenario is that GDP per capita goes up but workers get poorer, and making workers whole requires massive redistribution. In my latest paper, I run the numbers and conclude that this is probably incorrect. marginalrevolution.com/margi…

Sean Dougherty 🌍 retweeted

In a past post, I highlighted that income per capita and fertility rates, once strongly negatively correlated across OECD countries, are now positively correlated:
xitter.gq/JesusFerna7026/status/…
Similar reversals have occurred in many other classic negative relationships between fertility and other variables. Today, I will examine one of the most frequently cited relationships: the link between female labour-force participation and fertility.
The exercise is the same as before. I use total fertility rates from the U.N. World Population Prospects 2024 and female employment data from the OECD Annual Labour Force Statistics, specifically female civilian employment as a percentage of the population aged 15 to 64. Then, I compute the rank correlation across the 18 countries with continuous coverage from 1970 (as early as I can go): Australia, Austria, Belgium, Canada, Finland, France, Germany, Ireland, Italy, Japan, Korea, New Zealand, Norway, Spain, Sweden, Switzerland, the U.K., and the U.S.
In 1971, the correlation between female labor participation rate and fertility was -0.74. That is, where women worked more in the market, they had fewer children on average. This is the standard story everyone has in mind (and one of the most frequent comments readers make): since market work and child-rearing compete for mothers' time, higher female labor participation leads to lower fertility.
The fascinating observation is that the sign of the correlation changed rapidly during the 1980s. The correlation was still -0.47 in 1981, crossed zero in 1985, and reached +0.52 in 1988. This large flip occurred in just a few years, well before the arrival of smartphones or the large immigration flows of the 1990s and 2014-2024. Since 1988, the positive correlation has gradually eroded to about +0.30, but higher female employment still predicts higher fertility, albeit less strongly than it did around 1990.
Again, the question for your favorite theory of fertility is: how does your explanation account for this abrupt reversal in the 1980s across 18 rich economies?
As with all empirical work, some caveats are important. First, yes, 18 countries constitute a small cross-section. The year-to-year wiggles after 1990 are mostly noise, so take only the broad pattern seriously. But I believe that, by the year 2050 or so, this will be the shape of the relationship between female labor participation and fertility for the whole planet (or most of it).
Second, the baseline OECD annual series ends in 2013. To extend the sample to 2023, I switched to a second OECD series, the infra-annual labor statistics, which reports participation rather than employment. Since the two series overlap from 2005 to 2013, I can check that they differ by only 0.07 on average. I plot both rather than splicing them into a single line so you can judge it yourself.
Third, Luxembourg is excluded. Many of its workers are cross-border commuters, not residents, which produces figures that don't make sense. Also, Norway is missing 1971 (who knows why?), so I interpolate it.
And as always, credit where it is due. Namkee Ahn and Pedro Mira first documented this reversal in "A note on the changing relationship between fertility and female employment rates in developed countries," Journal of Population Economics, 2002. Tomas Kögel, in the same journal in 2004, argued that the cross-country sign flip reflects unobserved country heterogeneity rather than a change in the underlying relationship. I find Ahn and Mira's argument more convincing, but you should read Kögel as well.
Comments always welcome!


One of the claims in “Terra Incognita” that readers have found most interesting is that income per capita and fertility are now positively correlated across OECD countries: the richer a country is, the higher its fertility.
To document this claim more carefully, I have completed the following exercise.
I take total fertility rates from the U.N. World Population Prospects 2024 and real GDP per capita from the new Penn World Table 11.0 (expenditure side, chained PPPs, released in October 2025 and now running to 2023). For each year from 1954 to 2022, I compute the rank correlation across countries between fertility and real GDP per capita and plot the results. I use 30 of the 38 countries that are OECD members today (regardless of when they joined). I drop the other eight because they have data gaps, as former socialist economies did not compute GDP using the standard methodology (Czechia, Estonia, Hungary, Latvia, Lithuania, Poland, Slovakia, and Slovenia).
In the mid-1950s, the correlation among the 30 countries was about -0.32, and it deepened through the 1960s and most of the 1970s, until a minimum of -0.78 in 1977. This is the world most people have in mind: the opportunity cost of children rises with income and, the richer you are, the fewer children you have. Gary Becker and dozens of economists wrote papers trying to understand this pattern.
But then, in 1977, well before anyone had heard about smartphones, social media, or some of the other “usual suspects” behind the recent drop in fertility, something changed: the rank correlation started climbing in a steady way, becoming positive in the second half of the 2010s. Right now, being richer means having higher fertility rates. And, as far as I can tell, there is no indication this trend is slowing down.
So, if you have a favorite explanation for the evolution of fertility over the last few decades, ask yourself: how can my explanation account not only for the drop in fertility but also for the rank correlation switching directions in 1977?
A couple of warnings. First, I use the rank correlation because it is immune to outliers. Luxembourg and Ireland report GDP per capita figures that nobody should take at face value.
Second, I am using the U.N. World Population Prospects 2024, which I have criticized for overestimating the fertility rates of the poorest OECD members (Mexico, Colombia, Costa Rica, Türkiye). If you use the fertility rates reported by their own statistical agencies, the rank correlation is even more positive. But I don’t want anyone accusing me of fiddling with the data.
Finally, credit where it is due: I first learned about this reversal from Doepke, Hannusch, Kindermann, and Tertilt, “The Economics of Fertility: A New Era,” in Lundberg and Voena (eds.), Handbook of the Economics of the Family, vol. 1, North-Holland, 2023, pp. 151-254. Anyone who wants to go deeper should start there.
Comments always welcome!

Sean Dougherty 🌍 retweeted
Last week I posted a new paper with Patrick Norrick: “Terra Incognita: The Economics of a Shrinking World.”
We chose the title deliberately. No society in history has experienced the fertility levels now seen in South Korea, China, Thailand, Colombia, Chile, and many other countries. Our knowledge of the causes (and of the economic consequences) remains far more limited than most public discussion acknowledges. Much of what we write is, at best, educated conjecture.
The paper also struggles against a space limit. We wrote 20,000 words, far from the 250,000 or so we would need to address some issues in more detail (if I had the time and resources to hide away for a year, I could do that, but not now). That means some ideas are only sketched.
Nonetheless, we emphasize several important points.
First, fertility has fallen very fast everywhere: rich and poor countries, east and west, north and south, conservative and liberal societies, religious and non-religious societies (with the exception of the Jewish population of Israel; fertility has also collapsed among the Muslim population within the pre-1967 borders), you name it. Even in sub-Saharan Africa we see fast and unprecedented drops in fertility (alas, from a high initial level).
Second, and this is really interesting, the fertility collapse has been concentrated in poor and lower-middle-income countries much more than in rich countries. By now, income per capita and fertility are positively correlated within OECD countries. We conjecture this will hold globally in a few decades.
Third, and related to the second point, the fertility collapse has been concentrated among poor and lower-middle-income women within countries. In countries such as the U.S., the rich and highly educated now have more children than the poor and less educated.
Fourth, we document why we do not understand the data from the U.N. World Population Prospects. See, for example, Tables A.1 and A.2.
Fifth, we explain why some proposed mechanisms struggle when confronted with the data.
A more subtle point is at work here. Many commentators do not seem to understand the difference between proximate causes and ultimate causes. Yes, births might have gone down because fewer women are in long-run relationships. That is the proximate cause. But you need to explain why fewer women are in long-run relationships (the ultimate cause), and saying that they spend more years in school, to take one example, does not get us very far. Why do they spend more years in school? Once you start down the whole chain of reasoning, things become much harder than they seem.
The paper can be found here:
sas.upenn.edu/~jesusfv/Demog…
Comments always welcome!

Sean Dougherty 🌍 retweeted

.@BharatKChandar, @RuyuChen and I just released an updated version of our paper "Canaries in the Coal Mine?"
The headline is that we still don't see any widespread job displacement due to AI, but the earlier trends we identified hold up or even grow. E.g., the relative decline for young people in AI-exposed jobs widened to 19% by June 2026, from 15% in our first wave.
We also looked at changes in interest rates, remote work, the tech sector boom and bust and remote work, but none of them seem to explain the effects we see for AI-exposed jobs.
Bharat has a great thread below with more detial. It ends with links to the new paper and to a short blog post summarizing what's new.
I'd love to hear what you think.


Sean Dougherty 🌍 retweeted
Defence spending is rising fast, but its effects aren’t only national. 💸
New OECD #NFR study on what higher defence outlays mean for subnational governments: local spillovers, revenue effects, spending pressures & intergovernmental coordination. ⚖️
👉🏼 oe.cd/FFwp52

Sean Dougherty 🌍 retweeted

Everyone from Weber to Mokyr puts culture at the center of the rise of the West. But nobody has had a long-run cultural series you could drop into a growth model.
So I built one: LLMs read 23,000 books from the Western canon, scoring what each endorses.
Year 0–1920, one chart:

Sean Dougherty 🌍 retweeted

Very interesting that FT publishes this graph--everyone with even superficial knowledge of the data knows it is misleading or just plain wrong. @johnvanreenen

Sean Dougherty 🌍 retweeted

The economic footprint of Europe’s defence build-up
@Luizdemello2, Ines Dezcallar @oecdeconomy, @econecho
ow.ly/CaRw50ZkxkL

Sean Dougherty 🌍 retweeted

What counts as a “local tax” when tax rates, bases or tax-sharing arrangements are shaped by higher-level governments?
A 🆕OECD Fiscal Network paper revisits local tax attribution, fiscal decentralisation and effective local taxing power.
Read more🔗brnw.ch/21x3QCM

Sean Dougherty 🌍 retweeted

Dear followers,
Please see this new article from @MITSloan on pro-worker AI, which draws from my recent paper with David Autor and Simon Johnson for @BrookingsInst
mitsloan.mit.edu/ideas-made-…

Defence spending is rising fast, but its effects aren’t only national. 💸
New OECD #NFR study on what higher defence outlays mean for subnational governments: local spillovers, revenue effects, spending pressures & intergovernmental coordination. ⚖️
👉🏼 oe.cd/FFwp52
Sean Dougherty 🌍 retweeted
I will streamline the sources to help anyone who wants to go down this rabbit hole. Maybe yo u can give it to your (smart, not dumb!) LLM and make it a nice summary- place it below if you do and I will RT).
1. Two Europes post with @OlivierKooi : Core Europe is diverging from US, East is converging, and the war is helping a reformist reprioritization that will expand the gap between North and East and Core and South:
siliconcontinent.com/p/the-t…
2. @paulkrugman "Is Europe in economic decline?" paulkrugman.substack.com/p/i… plus his transparent model note, which he calls incomprehensible but is in fact clear and helpful for economists. paulkrugman.substack.com/p/m…. Key point: everyone in Europe shares in the gains from the IT revolution through lower prices, so Europe should not panic. "Don't worry, be happy". (My words, not his.)
3. Our reply (with @pietergaricano) "European Stagnation is real": tech-based returns to capital--spread through in 401Ks and reaching mostly US citizens and institutions, and agglomeration economies (centered in SV/Austin etc) benefit US disproportionately and set up an unequal future. Krugman pushes the walking around test, we argue do the driving around test and you will see: siliconcontinent.com/p/europ…
4. Krugman's response to us argues standard productivity growth does not mean what people think for cross-country welfare comparisons, and that PPP/current-price comparisons do not show a widening gap. paulkrugman.substack.com/p/c…
5. Our response, in Proj Syn, with @Ph_Aghion and @a_bergeaud (I link the one today, since it is ungated and contains the postscript rejoinder): Main point. chained PPPs are misleading for growth comparisons and the fact they do not show a growing gap is not meaningful. The flat line Krugman sees as parity is the change in the measuring stick, not a convergence of the economies. siliconcontinent.com/p/the-m…
6. @paulkrugman response yesterday, basically agreeing that productivity growth diverges, but with the points in my main tweet above, and the agreements and disagreements we summarized:
paulkrugman.substack.com/p/e…
A lot of what follows is gated, so harder to follow:
@wsj @josephsternberg: Europeans may wish to choose welfare over growth, but at least politicians and analysts need to acknowledge the tradeoff --and voters need to be told there is one!
wsj.com/opinion/europe-can-b…
@washingtonpost @asymmetricinfo takes the driving around test and argues that inherited urban beauty can make Europe look richer on foot, while US abundance shows up more in space, housing, appliances, suburbs, and private consumption washingtonpost.com/opinions/…
@MESandbu argues to some extent all measures are wrong, and we are talking past each other, but we are both equally right and wrong: ft.com/content/8bdb63a2-b205…
@Noahpinion noahpinion.blog/p/yes-europe… argues pleasent stagnation will not cut it in the current world, particularly given geopolitical environment.
Sean Dougherty 🌍 retweeted

📢 Public finances in OECD countries face mounting challenges.
With high public debt and rising spending demands, stronger budget institutions and better public understanding are key to ensuring fiscal sustainability.
See the report: oecd.org/en/publications/res… #PublicFinances
Sean Dougherty 🌍 retweeted

Live today: the OECD Forum on Restoring Public Finances
Experts and policymakers will discuss how to strengthen public finances while building public understanding and support for reforms.
Watch live: brnw.ch/21x2R0N
