
crypto, nfts, fapping
The Netherlands
Joined November 2021
- Tweets377
- Following78
- Followers127
- Likes38.4K






fapmachine.eth retweeted

Share this message to the Prime Minister. @AlboMP
If you won’t use the powers you already have — don’t ask for more.
Australians have had enough.
fapmachine.eth retweeted
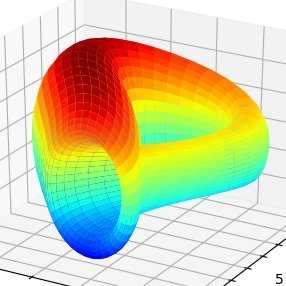
Seems like curve.fi DNS might be hijacked. Don't interact!

fapmachine.eth retweeted

I speak for the people @elonmusk.
Here is why everyone has lost their trust in you:
You took over this app PROMISING freedom of speech on the basis of it being a "bedrock of democracy" and framed it as per the 1st amendment of the US constitution.
People cheered and loved you.
You posted memes saying how X is superior to Meta and Youtube and you allow free speech.
People cheered and loved you more.
"FINALLY, a billionaire gets it!" everyone thought...
You then joined MAGA to help us put Trump back in office.
The people cheered and loved you even more.
Then, MAGA loyalists had a simple disagreement with you on H1B visas, and you let your emotions destroy the beautiful "town square" you worked for years to build.
You went on a suspension spree of the groypers who all have individual unique accounts with massive followings that don't "spam".
Hell, they even have a LEGIT LLC to represent their company. Everything was by the book, yet they were silenced.
You then went on to de-verify or insult several accounts that disagreed with you on immigration and Israel.
@ShaykhSulaiman @LauraLoomer @DrLoupis @SamParkerSenate @MyronGainesX @realstewpeters @jakeshieldsajj @NickJFuentes
Saying "freedom of speech isn't freedom of freedom of reach" or "freedom of speech doesnt mean paid speech" is EXACTLY how all the other platforms began their censorship regimes...
The very same platforms you rallied against for YEARS...
Taking away someone's monetization, subscribers, and reach IS censorship, and antithetical to free speech.
Why?
Because you create a chilling effect, which by definition, makes others scared to speak up and exercise their "free speech" that you promised.
That IS CENSORSHIP. Speech means nothing if it can't reach the "town square" in the first place.
It's not enough to just "allow" the speech.
You need to be able to allow ALL ideas to flow, and let the cream rise to the top.
You said this yourself, when you unbanned Nick Fuentes.
You said community notes will curb and stop disinformation.
Allow complete free speech, stick to your word, and refine community notes to tackle disinformation.
That is how you will regain the people's trust.
People WANT to like you Elon.
Just do the right thing first.
Retweet and share this post if you agree.
Let's make X free speech and GREAT again...
fapmachine.eth retweeted

I hold zero coins.
I endorse zero coins.
I make zero money.
However there are now hundreds and hundreds of coins associated with me.
Should I make a list of which coins are GAY and which coins are NOT GAY.
This is not endorsement. But its pride month.
We should know which gay coins have gay holders and which G coins have G holders.
10,000 retweets and I clean up this mess.
fapmachine.eth retweeted

The $MAD Airdrop Begins in 1 hour! You coming?
🧪 $118,118 Worth of $MAD up for grabs 🧪
How to take part: zealy.io/cw/madmetaverse/que…
Read the blog here:
madmetaverse.medium.com/mad-…

fapmachine.eth retweeted

26k followers away from 400,000.
If you’ve been enjoying my content lately, give this a like/share to support and help me make it happen 🫡
fapmachine.eth retweeted
If I had to sum up my argument for why we won't see 20k or below in a single chart- with the most straight-forward logic I can think of- it would be the one below.
Now follow along and really understand what is being said here- the context is important to understand the logic presented with the chart at the end of this post.
I've already shown in prior posts how aggregate OI has played a significant role in local tops/bottoms over the last 12+ months- and logically, it makes sense why:
Long term spot holders continue to be net buyers of BTC, with the total amount of $BTC being HODL'd at all time highs and climbing. These holders aren't very susceptible to price swings- they tend to accumulate in all market conditions at these prices- even adding to their stacks through the FTX collapse.
Meanwhile, most of the volatility on BTC over the last year has been driven by levered players and their liquidations- we know this because every significant top and bottom on $BTC over the last 12+ months has been marked by a significant top/bottom on OI (which is a measure of the number of leveraged contracts open in the market at any given time) and liquidations.
Why is this the case? Well if spot holders are net buyers and not susceptible to sell their stacks during volatile price swings, then the ONLY way to get significant moves to the downside is via forced selling/liquidations of levered contracts, and the POTENTIAL for forced selling/liquidations can be measured by how high or low aggregate OI.
The HIGHER OI is, the more opportunity/potential there is for a large flush to the downside (because there are more "liquidation-susceptible" leveraged contracts open) and the LOWER OI is, the more difficult it will be to force price to the downside (because there are less "liquidation-susceptible" leveraged contracts open).
So why is seeing 20k or below on $BTC here so improbable?
If we take the below chart and look at the data we have we can see that aggregate OI at around 6B has proved to be a historical bottom (which has been steadfor the last 12+ months (marked by peak fear/panic at FTX collpase bottom) and around 11B has been a local top.
Our last major flush that we had in August wiped out nearly 3B in OI (from 11B down to under 8B) but still failed to break our last major low at 24.8k.
We now trade at nearly the same price as when that flush triggered, however, aggregate OI is now down from nearly 11B at the time of our flush in August to only 8.5B at this time.
Meaning we are now in the same spot we were before the flush to 25k BUT there are now ~50% LESS liquidation-prone levered positions in the system vs what there was in August.
Even betting on a break of 24.8k is betting against the odds- as you would be looking for a move down of greater magnitude than the flush in August with HALF as much ammo (liquidation susceptible leveraged positions) available to cause that flush.
To then call for prices of 20k and lower makes absolutely no sense to me- and I don't see any logical argument based on the data we have to support a claim like that. For this to happen you would need either:
1. Unprecedented spot selling- the likes of which we haven't seen in years- by a category of holders that are least susceptible to fluctuations in price.
2. Enough liquidations to fuel a break of the 6B OI level which has marked our bottom for over 12+ months including during peak fear/panic during the FTX collapse that marked our last major bottom at 15k.
As usual, I'm always open for a respectful discussion with those that may challenge these views with logic, facts, and data of their own. So if you know some that are calling for 20k and below, tag them in the post below, as I'd love to see some hard data that supports the idea of a move back below these levels (lines pointing down don't count) to challenge my own ideas.
That's all for now folks, if you found this interesting please like/share/comment below!


Too many people looking for those levels when we haven't even broken market structure to the downside AND our last bottom at 24.8k was formed due to the biggest liquidation event in over a year (yes, 2x bigger than FTX collapse at 15k).
You would need some serious liquidations to send us that low and based on aggregate OI there isn't nearly enough in the system atm.

fapmachine.eth retweeted
Incomesharks has been hacked. DO NOT click on any of the links in his recent tweets, your wallet will get drained!
fapmachine.eth retweeted

🚨 QUETZAL BATTLE STARTS THIS WEEK!
🐸 The army is trained & prepared to face the legendary Quetzal head-on
⚡️ Quetzal Returns on Thursday, July 27th
🕰 6:00pm PT // 9:00pm ET
Join the epic showdown at:
duckgod.supducks.com/
fapmachine.eth retweeted
📱 2 years ago today, SupDucks took the internet by storm!
Since then, we've been on a wacky journey of
🌴 Building
🌴 Innovating
🌴 Learning
and Expanding.
🦆 Join us as we kick off an epic week of celebration!
duckgod.supducks.com/

fapmachine.eth retweeted
The chart below perfectly demonstrates all the reasons why I think most are going to be completely caught off guard over the next 6 months and into '24 and '25.
Whether you believe in a new ATH on #Bitcoin this year or not, this is an idea worth considering imo.
Let's dive in...
I have spoken for a while about my issues with the almost universally accepted idea of a 4 year, "halving" based cycle many times.
Rather, I've proposed the idea of a cycle that lengthens in time from peak to peak while also simultaneously decreasing in ROI from trough to peak.
This idea was originally presented in 2019 and a refined time horizon was presented in 2020, about 3 years ago, when $BTC was trading under 10k. That idea was shared here: xitter.gq/CredibleCrypto/s…
In the chart shared in the link above, it is clear is that moves from trough to peak were taking longer in time to complete and yielding a lower ROI from start to finish.
This is a very logical/expect conclusion as we know that volatility in any market naturally decreases over time as an asset matures and the earliest participants in any market always have the potential for the highest yield/ROI.
Based on the chart shared above in 2020, one of the conclusions that was made from it was that this next cycle would not end until "sometime after [the start of] 2023".
Fast forward to Q4 of 2021- we had broken prior all time highs as expected and were trading in the 50-60k range. At this stage, most were calling for a blow-off top into December 2021 and 100k+ $BTC in the next month or two.
Why? Well because of the "halving" of course.
You see, our last parabolic run/blow off top occurred exactly 4 years prior- in December of 2017 on our run to 20k. So based on the halving cycle theory, our next blow off top should have come 4 years later- in December of 2021. I was one of the very few at this time that was NOT expecting this- again based on my idea of a lengthening cycle- I believed that this next blow off top should occur in/after 2023.
So, in December of 2021, when we were trading at 60k+ and the masses were screaming for a blow-off top to 100k+, I published a Youtube video to explain why I expected us to find a local top soon and a correction to at least 30-40k before the *actual* blow off top wave occurred 6+ months later. A full, in-depth breakdown as to how/why I made these claims at the time can be found here if you want to understand the logic further (I recommend finishing this thread and then going back to watch the vid below if interested): youtu.be/uAVlOfpxRMQ
What followed was a major crash that hit my target of 30-40k and ended up going even lower due to a series of industry defining black swan events that created a domino effect of bankruptcies, collapses, panic selling and capitulation- 3AC/LUNA, Voyager, Celcius, FTX etc.
At this stage, while we had gone lower than my target of 30-40k, we had not yet hit the invalidation point for this cycle and so while the depth of this major correction was deeper than expected, the high timeframe thesis remained in-tact (logic behind this is also covered in the Youtube video linked two paragraphs ago).
This is where a major divergence occurs between my ideas and the currently accepted/agreed upon narrative- as the vast majority who witnessed this crash now assumed that our cycle HAD topped at 69k and we are now in the depths of a major bear market with no new all time highs to be expected until after the NEXT halving in 2024.
Meanwhile, I have maintained, in-line with my ideas shared in 2019, that our cycle that started in 2018 has not yet completed and that we are still missing a final "5th wave" to the upside which has now officially begun off of our lows at 15k. This final move to new highs above 69k would mark the end of a 5 year cycle, the longest cycle we have seen since Bitcoin's inception and in-line with the idea of lengthening cycles that I've proposed earlier.
"But Credible, why would this time be different? We always see new highs only AFTER a halving event. So we will only see new highs after the next halving in 2024."
People have been blinded by the halving narrative so much that they refuse to view Bitcoin's growth/progression through the lens of anything but a 4 year, halving driven, cycle. I have repeatedly stated that the halving is a KNOWN event, on a set schedule, and that this information is priced in. Especially because at this point 92% of all Bitcoin that will ever exist has already been mined! Take a look at this chart here that I've shared without a "halving" related bias and you will see the idea of lengthening cycles makes a lot more sense: xitter.gq/CredibleCrypto/s…
NOW if we look at that chart above we can see that a Bitcoin cycle top at 69k WOULD be "different", and that if this cycle "is not different" to prior ones the top SHOULD take LONGER to form than prior tops as Bitcoin matures, volatility declines, and ROI from trough to peak of each cycle decreases.
Interestingly enough, the idea proposed above is reflected beautifully in the chart shared below, which is what caught my eye and made me begin writing this tweet in the first place.
This same data/idea is unknowingly presented in the @glassnode chart below, except at first glance it is depicted through the lens of a 4 year, halving cycle narrative once again. Let's take that lens off and take another look:
I've added annotations to the original chart and the key takeaways are:
1. Every cycle on Bitcoin since inception EXCEPT the one with a proposed top at 69k supports the lengthening cycle, lower ROI thesis.
2. IF our cycle did top at 69k it would be THE FIRST TIME that a full cycle has taken the SAME amount of time as a prior one.
3. IF our cycle did top at 69k it would be the ONLY cycle that topped with a YEAR LONG RANGE as opposed to a blow-off top.
Just like every prior Bitcoin cycle, the cycle that started in 2018 should NOT be over yet, it SHOULD take longer than the prior one, and it SHOULD yield a lower ROI as well.
Our "cycle top" being in at 69k would go against ALL of the above.
So my argument is simple- this time is NOT different.
We have yet to see the final 5th wave blow off top for this cycle that started in 2018 and we should see new all time highs on Bitcoin this year leading up to it. (For my best guess on when we see new highs, view this tweet here: xitter.gq/CredibleCrypto/s…)
If you liked this mini novel, please like and share.
I also challenge you guys to tag those in the comments that are staunch believers of the halving cycle narrative. Encourage people to open their minds to an idea they have potentially dismissed. Ask them to read this thread and give it a genuine chance, with no pre-conceived notions. I'm always open to respectful discussion of ideas from those with opposing viewpoints and I think it's always important to keep an open mind and consider ideas that run against the grain. If you agree, spread the word!


fapmachine.eth retweeted

Meet Xinoko ⚔️
He will be selecting & acknowledging those who are Limitlisted for the upcoming Genkai mint.
Follow to stay updated: @Xinoko_ck
fapmachine.eth retweeted
PSA: I have lost my check mark because I changed my PFP and scammers are now taking advantage of this.
I DO NOT have a “FUND MANAGEMENT SERVICE” and I will NEVER solicit you for money or crypto in ANY way.


fapmachine.eth retweeted
Pictured below is a key metric I will be watching in the coming weeks to help identify when our bottom may be in and when we may be ready to start our next impulsive move to new all time highs. This is a long post BUT trust me you will learn a lot if you take 5 minutes to read it👇
Pictured below is a cha price with another chart of aggregate open interest below.
We can see that every time aggregate open interest hits about 10B, it tends to mark a local top and every time aggregate open interest hits about 6B, it tends to mark a major bottom.
So what is aggregate open interest and why is there this type of correlation?
A simple way to interpret aggregate open interest is that it is a measure of the total amount of leveraged positions currently open across all included exchanges.
In other words- the higher aggregate open interest is, the more "frothy" the markets are as there is a larger amount open leveraged positions and these levered positions are all susceptible to liquidations if price moves against them.
So at periods of time when the market gets too frothy and open interest is at higher levels (in this case around 10B), we often see some sort of violent move that causes a spike in volatility as the market seeks liquidity and leveraged players/positions are liquidated.
If/when these players are liquidated, their levered positions are forcibly CLOSED, and this causes aggregate open interest to drop.
When most of the leverage has been flushed out of the system (in this case around 6B)- liquidations occur much less frequently which means volatility decreases and the price can then move back up (or down, depending on the trend) in a healthy manner.
So what can we do with this information and what does it tell us?
First off, at current levels, leverage is not extremely high or extremely low- we have found ourselves at the middle of our range- so what I am looking for now is a move to either extremity.
I have drawn two paths (green arrow and red arrow) that would likely take us to either extreme of our range.
RED ARROW (preferred): This path would occur if we continued down to the mid to low 20k region from current levels- a further flush down to a logical retest level (25k) with some potential wicks below from cascading liquidations (wicks into 23-24k are fine) that would ideally flush out remaining levered players and bring us back down to a minimally leveraged (healthy) market environment from which we can continue on our way up to 30k+ and ultimately new all time highs.
GREEN ARROW (alternate): Alternatively, if we continue up from here without getting a proper flush to 25k levels and aggregate open interest continues to climb and approach 10B as we push back into the 30k's- we have to remain cautious as it may simply be another fakeout to bait aggressive players in before a larger OI flush to sub 25k occurs.
Finally, is there a situation in which we DON'T need to revisit 25k and below and simply continue up and leave 25k and below untapped?
Yes, but in order for this to happen we would need to move up WITHOUT OI rising too much which would indicate that the move up is primarily spot driven, which is healthy and sustainable.
Overall I prefer the RED path as it would give us a visit to a logical support level and weekly bullish retest, while wiping out any excess froth from levered players which would allow us plenty of room to continue this healthy uptrend to new all time highs.
If you liked this post and/or enjoy this type of content, likes and retweets are appreciated!

fapmachine.eth retweeted

I do NOT have an Instagram account.
The only services provided by me are listed on my official website nebraskangooner.com and most of what I offer is free.
Don't ever send money anywhere else. Please don't get scammed by copycats and you can always DM me to verify.

fapmachine.eth retweeted

For those of you that placed more than 42 pixels on the Shapella Upgrade @POAPart canvas, go claim your POAP and join the raffle!
POAP:poap.delivery/shapella-pixel…
Raffle:poap.fun/2139
fapmachine.eth retweeted
Almost wrapped up with it and will be uploading soon.
Subscribe to my channel:
youtube.com/crediblecrypto
Turn notifications ON!

fapmachine.eth retweeted

And now you can also access @MetaMask Bridge via the “Bridge” button on the browser extension!🔸
xitter.gq/MetaMask/status/163899…


~Kind reminder: 🦊 MetaMask Bridge supports Arbitrum, Polygon, Optimism, Avalanche, BSC and Ethereum. Our bridging tool provides quotes across networks and providers, allowing users to choose a quote based on fees and transaction speed.
🔗portfolio.metamask.io/bridge
