

Transformamos datos complejos en narrativas
- Tweets170
- Following132
- Followers360
- Likes148





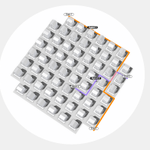


ALT Map of Austin with an Interstate-35 sign

ALT Map of the Grossglockner High Alpine Road in Austria with mountain icons

ALT Map of Europe and Africa with icons of bread, honey, cheese etc. on top, pointing towards Berlin

ALT Map of Helsinki with kids activities highlighted


ALT A metaphorical chart showing how a “blue wave” could affect current Republican seats in Congress during the U.S. midterm elections. As the scale of the potential "blue wave" increases, G.O.P. seats that would normally be considered safe are also under threat. Published by The New York Times.

ALT A chart visualizing Elon Musk's spending on U.S. midterm campaigns. So far, Musk has donated $446 million to political action committees (PACs), with America PAC spending more than $70 million on 43 races across 17 states. Of that, $34.7 million has gone into the Texas race. Published by The Guardian.

ALT A chart comparing weekly general ad spending in toss-up Senate races. The Texas and Ohio races have recorded the highest amounts of ad spending, with Republicans spending $32.8 million and Democrats $15.1 million in the Texas race and Republicans spending $30.6 million and Democrats $25 million in the Ohio race. Published by Bloomberg.

ALT A chart showing a breakdown of partisan ad spending in the US midterms, highlighting spending differences between Democrats and Republicans. While many of the most significant differences in spending are found in races with low overall spending, the Texas Senate race is an exception, with the Republicans spending $268 million compared to the $130 million spent by the Democrats. Published by The New York Times.


