

Transformamos datos complejos en narrativas
- Tweets170
- Following132
- Followers360
- Likes148






ALT Map of Austin with an Interstate-35 sign

ALT Map of the Grossglockner High Alpine Road in Austria with mountain icons

ALT Map of Europe and Africa with icons of bread, honey, cheese etc. on top, pointing towards Berlin

ALT Map of Helsinki with kids activities highlighted

ALT A metaphorical chart showing how a “blue wave” could affect current Republican seats in Congress during the U.S. midterm elections. As the scale of the potential "blue wave" increases, G.O.P. seats that would normally be considered safe are also under threat. Published by The New York Times.

ALT A chart visualizing Elon Musk's spending on U.S. midterm campaigns. So far, Musk has donated $446 million to political action committees (PACs), with America PAC spending more than $70 million on 43 races across 17 states. Of that, $34.7 million has gone into the Texas race. Published by The Guardian.

ALT A chart comparing weekly general ad spending in toss-up Senate races. The Texas and Ohio races have recorded the highest amounts of ad spending, with Republicans spending $32.8 million and Democrats $15.1 million in the Texas race and Republicans spending $30.6 million and Democrats $25 million in the Ohio race. Published by Bloomberg.

ALT A chart showing a breakdown of partisan ad spending in the US midterms, highlighting spending differences between Democrats and Republicans. While many of the most significant differences in spending are found in races with low overall spending, the Texas Senate race is an exception, with the Republicans spending $268 million compared to the $130 million spent by the Democrats. Published by The New York Times.


ALT Hundreds of 3D figures colored by whether they say religion is important in their daily life. A line chart shows that in Western countries, young people are the most likely to believe in an afterlife without being religious, while in non-Western countries it's older people.

ALT A hand-drawn line chart showing the share of correct answers students gave on tests from 2020 to 2025. After ChatGPT became popular, scores on tests taken at their computers kept rising, while scores on proctored tests away from their computers dropped below where they had been before A.I.

ALT An alluvial chart showing how the 120 seats in Israel's parliament were split between parties in every election since 2009, with bands showing how members moved between parties. Likud stays the largest party, while the center parties keep changing names.

ALT A historical map of Washington's streets around the Capitol, colored by how often they were swept, from daily to once every two weeks.


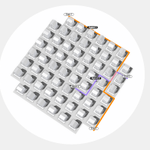
ALT 3D surface (mesh) chart showing territorial momentum in the Argentina vs. Egypt match, with blue peaks marking Argentina's pressure and red marking Egypt's across the pitch. The score sits at 0–1 to Egypt in the 29th minute of the first half, with a small momentum area chart tracking the swing along the bottom.

ALT Connected-path map titled "International football's centre of gravity," tracing the weighted geographic mean of national teams (by men's Elo rating) from 1901 to 2026. The point starts over Britain, loops out into the Atlantic west of Portugal through the 1920s–40s, then drifts steadily southeast past Spain and Morocco toward the western Mediterranean, reflecting the sport's spread beyond Britain.

ALT Slope chart titled "Most Middle East Countries Have Shifted Away From Iran," tracing how regional countries' alliances with Iran changed from before the Gaza war to after the US–Iran ceasefire, across four levels from "Friendly with" to "Hostile with." Most lines slope downward — countries like Qatar, Syria, Lebanon and Saudi Arabia move toward more suspicious or hostile positions — while Iraq stays friendly and Pakistan and Turkey stay neutral.

ALT Infographic "Italy's Warming Waters," charting 37 marine heatwaves around Italy from 2008 to 2025. A grid of small peak-shaped area charts shows each event's temperature anomaly and duration (coloured moderate orange or strong red), followed by a dot timeline showing rising frequency, a waveform of heatwave durations, and a bar chart of events by season. Marine heatwaves are getting more frequent, longer, and are no longer confined to summer.


