

Breakout charts 🚀. Monthly, Weekly, Daily - when I see them, I share them. 'A nonce in the block.' ⚡
Joined October 2020
- Tweets1.8K
- Following1.2K
- Followers203
- Likes3.1K





Breakout ⚡️ retweeted

GALAXY $GLXY Q3’26 EARNINGS HIGHLIGHTS
🔹 Revenue: $8.7B
🔹 Adj. EPS: $0.83 (Est. -$0.06) 🟢
🔹 Net Income: $322.8M
🔹 Adjusted EBITDA: $454.7M
Segment Adjusted Gross Profit:
🔹 Digital Assets: $71M
🔹 Data Centers: $79M
🔹 Treasury & Corporate: $419M
Other Q3 Metrics:
🔹 Cash, Stablecoins & U.S. Treasuries: $4.9B
🔹 AUM & Assets Under Stake: $10.4B; +46% QoQ
🔹 Net Inflows: Over $160M
🔹 Average Loan Book: $1.8B; +27% QoQ
🔹 Data Center CapEx: $757M; +69% YoY
Capital Return:
🔹 Buyback Authorization: $200M
🔹 Shares Repurchased: Approximately 9.8M YTD
Announcements:
🔹 Data Center Power Pipeline: Over 5.7 GW
🔹 Helios I, Phase II: Fully financed and under construction
Comments:
🔸 “The progress we're making across both businesses is strengthening and diversifying our earnings profile, while positioning Galaxy to capitalize on substantial growth opportunities.”

Breakout ⚡️ retweeted
$SOFI TECHNOLOGIES Q3’26 EARNINGS HIGHLIGHTS
🔹 Revenue: $1.4B (Est. $1.25B) 🟢; +44% YoY
🔹 Adj. EPS: $0.18 (Est. $0.16) 🟢; +64% YoY
🔹 Adjusted EBITDA: $469.8M; +70% YoY
🔹 Members: 17.1M; +35% YoY
FY26 Guide:
🔹 Adj. Revenue: ~$5.04B (Est. $4.87B) 🟢
🔹 Adjusted EPS: ~$0.61 (Est. $0.59) 🟢
🔹 Adjusted EBITDA: ~$1.66B
🔹 Adjusted Net Income: ~$840M
🔹 Member Growth: At least +30% YoY
FY27 Guide:
🔹 Adj. Revenue: ~$6.4B (Est. $6B) 🟢
🔹 Adjusted EPS: ~$0.90 (Est. $0.82) 🟢
🔹 Adjusted EBITDA: ~$2.24B
🔹 Adjusted Net Income: ~$1.28B
Segment Net Revenue:
🔹 Lending: $821.3M; +66% YoY
🔹 Financial Services: $525.1M; +25% YoY
🔹 Technology Platform: $87.4M; -24% YoY
Other Q3 Metrics:
🔹 Total Products: 26.7M; +44% YoY
🔹 Fee-Based Revenue: $570.6M
🔹 Net Interest Margin: 6.14%
🔹 Total Deposits: $51.3B
Comments:
🔸 “We are adding more members, who are using more products, and generating more revenue per product to create the most value for our shareholders over the long run.”
🔸 “Our conviction in the opportunity ahead has never been greater.”

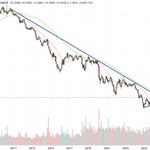
King Coal - chart of the day.
The Macro W Bottom (decade-long)
Blue zig-zag from 2011–2022 formed a classic double bottom / “W.” Resistance sat at $4.57–$5.59. Clearing $5.59 in 2022 flipped the entire long-term structure from bearish to structurally bullish.
The Flag / Wedge
After topping near $10, price spent ~2 years grinding lower inside a descending black trendline. Textbook bullish flag / falling wedge.
Breakout + Retest
It has cleanly broken above that black descending line. Current price ~$7.79–$7.80 is a textbook retest — former resistance now acting as support, and so far it’s holding.
Key Levels
• Must hold: $7.00–$7.50 (the broken trendline) on a monthly close.
• Immediate target: $9.42. Clear that and $10+ comes into play.
• Longer-term projection: The steep blue diagonal points toward meaningful new highs into 2028 if the broader energy tape stays supportive.
As long as price stays above that black downward-sloping line, the bulls remain in full control. One of the cleaner continuation setups on the chart.


1
20
Breakout ⚡️ retweeted

BREAKING: A radioactive peptide that targets cancer cells and delivers radiation to destroy them has just succeeded in a Phase 3 trial.
Breakout ⚡️ retweeted

ARAMCO CEO Amin Nasser: Commercial onshore inventories are now well below six billion barrels, and they are the last available buffer
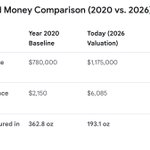
The First Majestic $AG share price remains near $17.30 in October 2026, close to the roughly $20 level at the end of 2012.
Market capitalisation has roughly tripled from about $2.3–2.4 billion in 2012 to around $8.5 billion now, yet most other metrics have grown substantially more.
Revenue has expanded 5x from $247 million in 2012 to $1.26 billion in 2025 and about $1.64 billion on a trailing basis, while free cash flow has moved ~9x from negative $39 million to positive $315 million in 2025 and strongly positive recently.


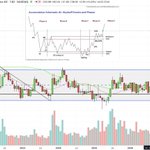
$CRSP - Chart of the Day feat. Wyckoff accumulation:
- Long markdown.
- Cause built for years inside the box.
- Spring flushed the weak hands in 2025.
- Price is now sitting above that low, holding the $45 line, coiling under resistance.
Very much Phase D behaviour. The spring is in. Supply is getting absorbed. Volume is showing up on the green days. All that’s left is the Sign of Strength through the top of the range.
- $45 holds = the setup is alive.
- Lose $45 = it was just another range.

3
170
Share-accretion ranking across the AI/HPC miner group - measuring whether additional equity has translated into more operating capacity, revenue/EBITDA and contracted value per share, not just bigger headline numbers:
1. $HIVE — 72/100
Best realised operating accretion. HIVE has diluted heavily, but it has already converted capital into a much larger mining fleet, sharply higher revenue and positive adjusted EBITDA. The caveat: most earnings are still Bitcoin-mining led; HPC remains early.
2. $IREN — 66/100
Best forward accretion potential, but weakest historical per-share proof. IREN’s dilution has been extreme, yet it has built a far larger AI-cloud revenue and contracted-ARR pipeline. It ranks below HIVE because execution, capex and further ATM dilution risk remain high.
3. $HUT — 54/100
Lower dilution than HIVE and IREN, with substantial power and AI-data-centre optionality. But the per-share earnings conversion is less visible today: the market still needs proof that its powered land, development pipeline and financing structure turn into sustained cash flow per share.
4. $GLXY — 51/100
Lowest dilution risk, but less direct operating accretion. Galaxy has a diversified platform—trading, asset management, investment banking and Helios infrastructure—so a mining-style capacity-per-share framework understates some value. It needs to be judged more on NAV/share, fee earnings/share and Helios monetisation.
Bottom line: $HIVE has delivered the clearest *realised* per-share operating build; $IREN has the strongest *forward* upside if its AI contracts ramp as planned. $HUT and $GLXY carry less dilution pressure but have more to prove on near-term per-share cash-flow conversion.
Breakout ⚡️ retweeted

2026 will be the 6th consecutive year of annual silver shortfall which is forecast to be a
~150M oz supply deficit in 2025/26. That is equivalent to 10 @FMSilverCorp which has taken 20+ years to build.
@keith_neumeyer $AG #TripleDigitSilver #BuyPhysical #GotSilver @FirstMintLLC

Breakout ⚡️ retweeted

Prediction: within 12 months, top three models will be open source.
Economic winners will be the American clouds that serve them:
Nebius
Iren
Baseten
Together
Fireworks

Looks like today may be a record day for token volume % of open models on Vercel AI Gateway:
🟦 Open 78.4% 🟨 Closed 21.6%
While spend 💲 usually tells a different story, #3 and #4 today are Moonshot AI & DeepSeek. Adding Z.ai, their combined spend surpasses OpenAI (#2).
(Do note that's the spend for inference of the model across providers (mostly in the US), not revenue going directly to the open weight labs.)

The 2024 $silver deficit narrative hasn’t vanished.
Peak shortfall was 254 Moz in 2022. Then: 2023: –200 2024: –138 2025: –40.3 2026F: –46.3
Six years running. Cumulative drawdown since 2021: 762 Moz — roughly a full year of mine supply.
High prices cut jewelry, silverware and solar loadings. Recycling rose. Mine output barely moved (most silver is a byproduct). Inventories got thinner anyway. That’s why London seized up in 2025 even as the annual gap shrank.
2027–29: still expected in deficit. No official year-by-year numbers, but Metals Focus says a swing to surplus would take an extreme mix of more supply and less demand. Structural tightness isn’t gone. It’s just quieter on the spreadsheet.
122


Breakout ⚡️ retweeted

$IREN retraced 66% of the move from 2023 to 2025 before going up 1400%.
It has now retraced 66% of the move from 2025 to 2026.


Breakout ⚡️ retweeted

ANTHROPIC CEO DARIO AMODEI:
AI’S EXPONENTIAL CURVE IS STARTING TO GET STEEPER
IT’S A WARNING SIGN THAT WE NEED TO SLOW DOWN.
Breakout ⚡️ retweeted

BREAKING: The IEA now sees no full Middle East oil recovery until 2027.
Important details:
– More than 10 million barrels a day of Gulf production remained shut in during August as Hormuz stayed restricted.
– Global oil inventories have fallen by 507 MILLION barrels since February.
– 95 million disappeared in August alone.
– And the IEA expects oil demand to FALL by 2.5 million barrels a day this year.
Demand is weakening and we’re still draining the buffer…
What happens if the recovery gets delayed again??
Breakout ⚡️ retweeted

BREAKING: China has told the US it intends to completely cancel the Trump-Xi summit planned for September 24 at the White House if the US approves any new arms sales to Taiwan before then, stating that Taiwan is a "red line" in bilateral relations, per multiple sources familiar with bilateral ties to Kyodo.
The summit is where Trump's demand that China stop doing business with Iran was to be put to Xi directly. China is Tehran's key economic partner, has repeatedly rejected US demands to cut that trade, and was the sole G20 holdout on the Hormuz statement this month, partly over concern the wording could later be turned on the Taiwan Strait.
#Breakout chart of the day 👀🚀
Aussie gold company recently went into production. Fifteen years to round out the bottom, broke out, now back to kiss the line. This is the retest, not the fail.
DM for ticker.

38